Envestnet PMC is an industry pioneer in blending the two opposing investment styles: active and passive. We have been implementing this approach within client portfolios well before the asset flow dominance into passive vehicles in recent years. We leverage Envestnet PMC’s core competencies of manager research and due diligence, manager selection, asset allocation, and active/passive research to engage with our clients. We know active management is cyclical, but we are firm advocates of active strategies. We recognize the benefits of passive investing, too.
Market overview
Building on a strong second quarter, the stock market extended its momentum into the third, as enthusiasm for artificial intelligence (AI) continued to drive gains with no signs of cooling. Major U.S. indexes posted robust gains, as the tech-heavy Nasdaq rose 11.41%, the S&P 500 gained 8.12%, and the Russell 3000 advanced 8.18%. September, historically a weak month for equities, was unusually strong, with the Russell 3000, S&P 500, and Nasdaq up 3.45%, 3.65%, and 5.68%, respectively. Despite persistent macro concerns, ranging from trade tensions and inflation to policy uncertainty, labor market cracks, and the ongoing government shutdown, stocks surged to new all-time highs. Both large and small caps participated, with smaller companies taking the lead and outperforming by a wide margin. The rally was fueled by resilient economic data, strong corporate earnings, continued AI investment, and the start of a new Federal Reserve (Fed) rate-cutting cycle. Investor preference for growth over value persisted, with –China trade truce and AI optimism. Developed markets outside the U.S. lagged both the U.S. and emerging markets.
The Fed cut the federal funds rate by 25 basis points in late September to 4.00%–4.25%, citing softening labor markets and slowing growth. The Fed signaled an additional 50 bps of cuts by year-end 2025. Treasury yields declined across the curve, with the 2-year and 10-year yields falling 12 bps and 8 bps, respectively, causing a slight curve steepening. Lower yields supported most bond sectors, and municipal bonds, which had struggled earlier in the year, posted market-leading results. The U.S. dollar, down 10.7% in the first half, stabilized in Q3, gaining 0.9%. Earlier dollar weakness and strong demand fueled a rally in precious metals, with gold and silver up 46.61% and 59.75% year-to-date, respectively. The dollar’s rebound, however, weighed on global bonds, which trailed U.S. fixed income. Commodities were modestly positive, as weakness in energy from expectations of an oil surplus offset gains in precious metals.
Our scorecard
Our ActivePassive Scorecard shows that active funds beat or tied our category benchmarks in 7 of the 19 asset classes we tracked in the third quarter. Year-to-date (YTD), active funds are ahead in only 3/19 of these categories. Over the trailing twelve months (TTM), active funds led our category benchmarks in 6 of these analyzed asset classes.
Active managers again delivered lackluster results in the third quarter. The same can be said of the YTD and TTM timeframes. Let’s delve into the performance details.
U.S. Equity
| Active Fund Category | Qtr Return | Vs. Benchmark | YTD Return | Vs. Benchmark | TTM Return | Vs. Benchmark |
|---|---|---|---|---|---|---|
| Large Cap Core | 6.76% | -1.24% | 12.85% | -1.75% | 14.11% | -3.64% |
| Large Cap Growth | 7.34% | -3.17% | 14.92% | -2.32% | 21.48% | -4.05% |
| Large Cap Value | 5.38% | 0.05% | 11.36% | -0.30% | 9.69% | 0.24% |
| Mid Cap Core | 4.68% | -0.65% | 7.17% | -3.25% | 6.93% | -4.18% |
| Mid Cap Growth | 4.08% | 1.30% | 8.69% | -4.15% | 12.84% | -9.19% |
| Mid Cap Value | 5.46% | -0.72% | 7.52% | -1.98% | 5.98% | -1.60% |
| Small Cap Core | 7.80% | -4.60% | 5.99% | -4.40% | 5.93% | -4.83% |
| Small Cap Growth | 7.13% | -5.07% | 5.85% | -5.81% | 7.78% | -5.78% |
| Small Cap Value | 8.18% | -4.43% | 4.85% | -4.20% | 4.90% | -2.99% |
Data from Morningstar as of September 30, 2025. The Morningstar US Active Fund categories used in this analysis represent US-domiciled mutual funds and exchange-traded funds classified as actively managed by Morningstar. The asset classes are represented by (in order of table): Russell 1000 TR USD, Russell 1000 Growth TR USD, Russell 1000 Value TR USD, Russell Mid Cap TR USD, Russell Mid Cap Growth TR USD, Russell Mid Cap Value TR USD, Russell 2000 TR USD, Russell 2000 Growth TR USD, and Russell 2000 Value TR USD.
Q3 saw large cap value managers continue their trailing twelve months (TTM) outperformance. Mid cap growth managers rebounded in relative and absolute terms through beating our benchmark by 1.3% in Q3. Elsewhere, active domestic equity managers lagged overall. U.S. stocks performed well, on an absolute basis, across the market capitalization spectrum during the quarter, but small caps and large cap growth led the way.
After a lengthy period of lagging, small caps finally surged during Q3. While some small cap funds excelled in this environment, many did not. Notably, the return dispersion among small company stocks has historically been higher than the dispersion of larger company stocks.1 This breadth of performance gives small cap managers the opportunity to either soar or sink in heightened ways. As we look at large caps, we see that market concentration has not lessened in growth or core indices. This market structure continues to pose challenges for large cap managers with mandated diversification. Mid cap managers don’t face either the extreme dispersion of small caps or the market concentration of large caps, but have still failed to deliver outperformance, in aggregate. That said, our investment research team is always working to identify top managers and present them to our research subscribers.
Non-U.S. Equity
| Active Fund Category | Qtr Return | Vs. Benchmark | YTD Return | Vs. Benchmark | TTM Return | Vs. Benchmark |
|---|---|---|---|---|---|---|
| Developed Markets | 5.04% | 0.27% | 25.21% | 0.07% | 16.06% | 1.07% |
| Emerging Markets | 8.87% | -1.77% | 24.82% | -2.71% | 16.19% | -1.13% |
Data from Morningstar as of September 30, 2025. The Morningstar US Active Fund categories used in this analysis represent US-domiciled mutual funds and exchange-traded funds classified as actively managed by Morningstar. The asset classes are represented by (in the order of table): MSCI EAFE NR USD and MSCI EM NR USD.
During Q3, international stocks continued to beat domestic equities on a year to date (YTD) basis. Both developed and emerging markets added additional gains during the quarter, but emerging markets performed best. Active managers, however, delivered aggregate outperformance in developed markets while lagging in emerging markets. We see the same relationship across the YTD and TTM timeframes.
The Quality factor was out of favor again in Q3 in international markets. This factor’s struggle was a headwind to many active funds, as Quality is generally sought by managers, particularly in the growth space. To put this situation in quantitative terms, the MSCI ACWI ex US Quality index lagged the core MSCI ACWI ex US index by 2.8% in Q3. If we look at quality over the YTD or TTM periods, the underperformance by Quality is even more significant, with the MSCI ACWI ex US Quality index lagging the core MSCI ACWI ex US index by over 10% and 12%, respectively.2
Why is the Quality factor out of favor? Declining interest rates, which are especially beneficial to highly indebted firms, and some speculative fervor may be to blame. We will continue to assess factor performance and how active managers respond, but it is not unusual for a factor to lag the market at times.
Fixed Income
| Active Fund Category | Qtr Return | Vs. Benchmark | YTD Return | Vs. Benchmark | TTM Return | Vs. Benchmark |
|---|---|---|---|---|---|---|
| Intermediate Bond | 2.04% | -0.00% | 5.99% | -0.14% | 3.01% | 0.13% |
| Short-Term Bond | 1.43% | 0.23% | 4.73% | 0.57% | 4.71% | 0.58% |
| Intermediate Muni | 2.60% | 0.41% | 2.85% | -1.66% | 1.81% | -1.61% |
| High Yield | 2.43% | -0.19% | 6.50% | -0.72% | 6.87% | -0.53% |
Data from Morningstar as of September 30, 2025. The Morningstar US Active Fund categories used in this analysis represent US-domiciled mutual funds and exchange-traded funds classified as actively managed by Morningstar. The asset classes are represented by (in order of table): Bloomberg US Agg Bond TR USD, Bloomberg US Agg 1-3 Yr TR USD, and Bloomberg Municipal 5 Yr 4-6 TR USD, Bloomberg US Corporate High Yield TR USD.
For Q3, active fixed income managers generally performed well. Active management relative performance weakens over the YTD period but strengthens over the TTM timeframe. Overall, fixed income performance was strong in Q3, too. On the taxable side, The Bloomberg U.S. Aggregate Bond Index returned +2.03% for the quarter, as the Fed cut short-term rates to 4.00-4.25% in September and Treasury yields declined modestly across the curve. The closely watched 10-year Treasury yield ended the quarter near 4.15%, down about 8 basis points (bps), reflecting weaker labor market data and the largest annual payroll revision in history. Volatility persisted due to labor market revisions, ongoing tariff uncertainty, and fiscal risks. Nonetheless, investor demand remained strong and credit spreads tightened across major sectors. Corporates (+2.60%), Securitized (+2.38%), and Government-Related sectors (+2.23%) outperformed Treasuries (+1.51%) in Q3. Longer-duration bonds and lower-rated investment grade credit (A and BBB) leTechnicals were strong with steady inflows and a risk-on tone, even as macro and policy uncertainty continued to weigh on investor sentiment. Credit spreads across investment grade sectors reached near multi-decade tightening. Spread dispersion among BBB-rated bonds remained elevated, potentially supporting active management. High yield bonds were buffeted by a couple of auto-related bankruptcies.3
Turning to munis, the municipal curve steepened further during Q3, with the 1s-30s curve slope increasing from +193 bps to +200 bps, its highest level since 2014. Continuing the trend from the previous quarter, longer maturities underperformed shorter maturities as the curve continued to steepen. Non-rated and below-investment grade issues outperformed as higher quality bonds lagged, and issues in the housing sector did particularly well. Municipals also broadly outperformed taxable bonds, with the Bloomberg Municipal Index returning 3.0% versus the Bloomberg Aggregate Index’s return of 2.0%.4
Record supply continues to be a dominant theme in the municipal market with YTD issuance rising to $428B, a year-over-year increase of 14%. This is down slightly from the 17% increase in Q2.5 While issuance remains on track to exceed the 2024 record amount of $500B, it is likely to continue to taper. Issuers that accelerated deals in the first half of the year amid concerns around tax changes in the One Big Beautiful Bill Act (OBBA) are unlikely to offer bonds again in Q4. Fundamentals remain steady for municipal issuers, with state and local tax collections up 5.1% year-over-year through June 30th.6
Diversifying Asset Classes
| Active Fund Category | Qtr Return | Vs. Benchmark | YTD Return | Vs. Benchmark | TTM Return | Vs. Benchmark |
|---|---|---|---|---|---|---|
| Commodities | 5.87% | 2.23% | 11.94% | 2.56% | 11.31% | 2.43% |
| Real Estate | 2.17% | -2.92% | 2.27% | -2.23% | -4.43% | -2.72% |
| TIPS | 1.82% | -0.29% | 6.55% | -0.32% | 4.01% | 0.22% |
| Bank Loan | 1.59% | -0.18% | 4.06% | -0.57% | 6.30% | -0.70% |
Data from Morningstar as of September 30, 2025. The Morningstar US Active Fund categories used in this analysis represent US-domiciled mutual funds and exchange-traded funds classified as actively managed by Morningstar. The asset classes are represented by (in order of table): Bloomberg Commodity TR USD, DJ US Select REIT TR USD, BBgBarc US Treasury US TIPS TR USD, and Morningstar LSTA LL TR USD.
In Q3, active commodities managers excelled. They have also delivered outperformance over the YTD and TTM periods as gold and silver kept climbing while oil stumbled until September. Other alternative asset class managers did not beat our benchmarks in aggregate during Q3, but active TIPS (Treasury Inflation-Protected Securities) funds outperformed over the last twelve months. Lower interest rates dampened the returns for floating rate debt, which includes almost all bank loan fund holdings. Real estate active managers haven’t yet benefited from declining yields, but that could change in the coming quarters.
Factor update
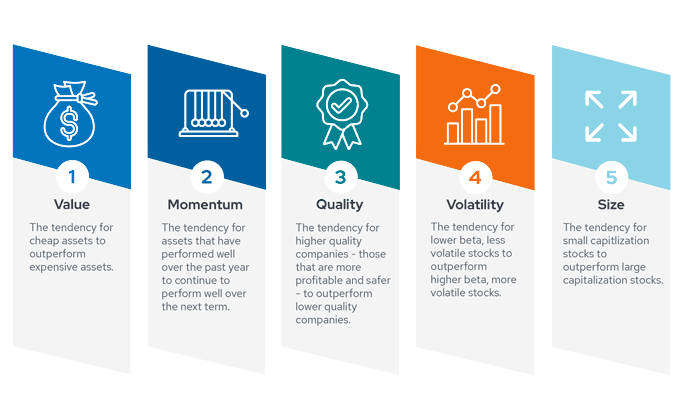
Below, we examine the performance of the five key factors (described by the infographic above) in the current market environment. This analysis is relevant to our scorecard because factors are integral to many active management strategies.
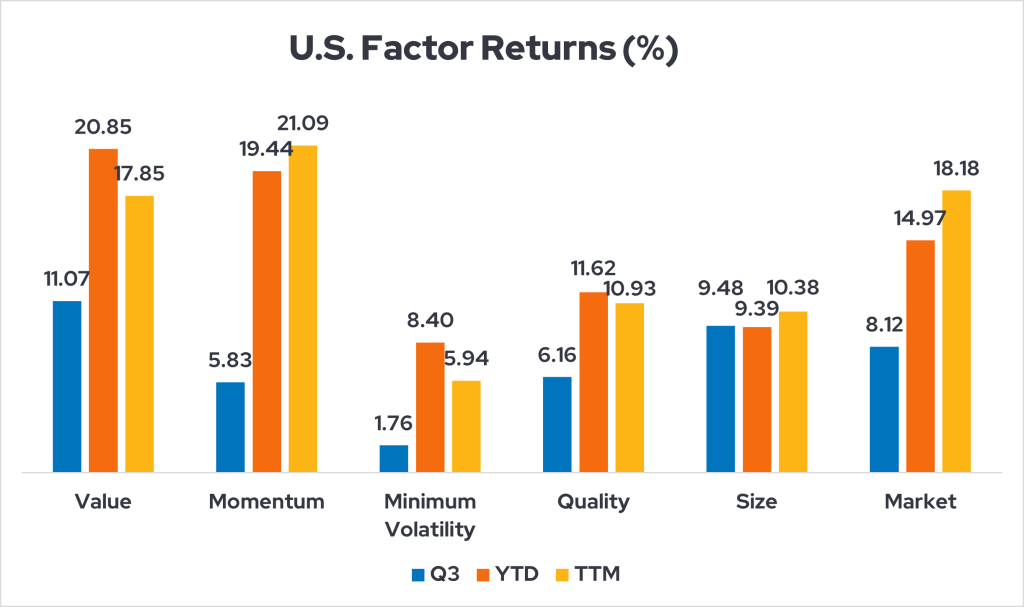
Data from Morningstar as of September 30, 2025. These indices represent U.S. factor returns: MSCI USA Enhanced Value, MSCI USA Momentum, MSCI USA Minimum Volatility, MSCI USA Quality, MSCI USA Small Cap, and MSCI USA GR USD.
- The Value factor rebounded sharply in Q3 to lead the way higher. It is now the best-performing factor this year, too.
- The Momentum factor remains the best performer over the TTM period, but it faced Q3 headwinds. As the Value and Size factors enjoyed a resurgence, Momentum stumbled.
- Just as the Quality factor has struggled internationally, it delivered only a middling domestic performance during Q3.
- In this risk-on quarter, the Minimum Volatility factor lagged.
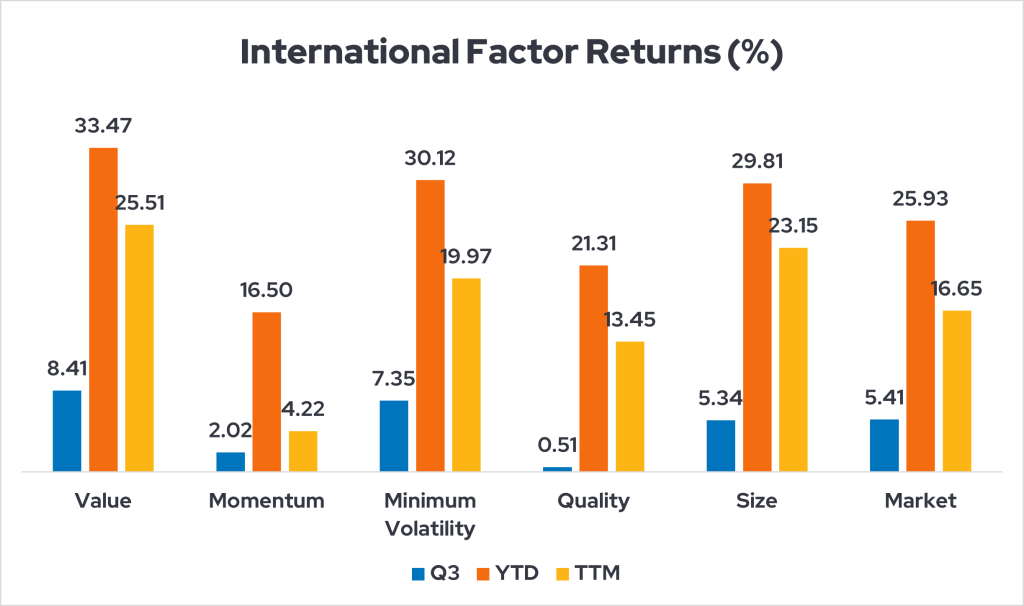
Data from Morningstar as of September 30, 2025. These indices represent international factor returns: MSCI ACWI Ex-US Momentum, MSCI ACWI Ex-US Enhanced Value, MSCI ACWI Ex-US Quality, MSCI ACWI Ex-US Small Cap, MSCI ACWI Ex-US Minimum Volatility, and MSCI ACWI Ex-US GR USD.
- The Value factor enjoyed strong returns in Q3 outside the U.S., which gave it leading YTD and TTM performance, too.
- The Minimum Volatility factor performed surprisingly well in a quarter with excellent overall gains in international equity markets. The Size factor also delivered solid results outside of the domestic market.
- The Momentum factor lagged somewhat during Q3, but the Volatility factor finished last among those tracked for this report.
Value in both active and passive management
This update on active and passive management covers a relatively short timeframe, but Envestnet PMC has a long history of research and portfolio management using our ActivePassive methodology. This framework requires patience and a deep understanding of cyclical trends. Ultimately, though, we believe there are places and times for both active and passive management.
Learn more about ActivePassive investing at www.envestnet.com/active-passive