Key Highlights
- Active funds outperformed benchmarks in eight of the 20 asset classes tracked during Q2 2026.
- Mid-cap equities and municipal bonds were among the strongest areas for active management, while small-cap equities and real estate favored passive exposure.
- Value and momentum factors led performance, reinforcing the importance of combining active and passive strategies across changing market environments.
Envestnet | PMC is an industry leader in blending the two opposing investment styles: active and passive. We have been implementing this approach within client portfolios well before the asset flow wave into passive vehicles in recent years. We leverage Envestnet | PMC’s core competencies of manager research and due diligence, manager selection, asset allocation, and active/passive research to engage with our clients. We know active management is cyclical, but we are firm advocates of active strategies. We recognize the potential benefits of passive investing, too.
Market overview
Equities staged a strong recovery in the second quarter of 2026, with major indexes rebounding sharply from Q1's losses as AI-driven earnings optimism and easing geopolitical fears outweighed persistent inflation and a more hawkish Federal Reserve. Earnings proved exceptionally strong, with 84% of S&P 500 companies reporting actual EPS above estimates, and the index delivering its sixth consecutive quarter of double-digit year-over-year earnings growth. A hawkish turn from new Fed Chair Kevin Warsh in June contributed to a brief episode of volatility near quarter-end as markets repriced the probability of rate hikes.
By quarter-end, the S&P 500 was up 15.2%, supported by strong earnings delivery, broadening market participation, and AI-driven momentum — even as the policy and inflation backdrop remain a source of ongoing caution heading into the second half. International stocks generated positive results during the quarter and overall performed in line with U.S. equities. The MSCI ACWI Ex-USA Index was higher by 14.5%. Asia was the strongest performer on a relative basis, with a return of +30.2%. Fixed income markets faced renewed headwinds during the second quarter, as an energy-driven inflation shock, a more hawkish Federal Reserve pivot under new Chair Kevin Warsh, and elevated geopolitical uncertainty from the Middle East conflict weighed on total returns across most sectors.
Treasury yields rose to their 2026 highs during the quarter, with the 2-year reaching 4.23%, the 10-year 4.67%, and the 30-year 5.18%, as markets priced out rate cuts and began pricing in hikes. The yield curve flattened following the June FOMC meeting, with short-term rates rising more sharply while the long end rallied modestly on growth concerns. Credit markets showed more resiliency than treasury bonds. By late June, investment-grade corporates were posting modest positive total returns, as all-in yields above 5% continued to attract a broad buyer base and corporate fundamentals remained supportive. High-yield bonds saw greater dispersion, with performance more differentiated across issuers as risk appetite grew more selective.
Global bond yields rose unevenly, reflecting regional differences in inflation sensitivity and monetary policy expectations. European bonds lagged amid energy-driven inflation, with markets pricing potential ECB rate hikes by mid-summer. Emerging-market debt proved more resilient, benefiting from the tentative U.S.-Iran peace deal and declining oil prices, with hard-currency sovereigns seeing spread tightening and local markets supported by an improving geopolitical backdrop. After a strong first quarter, commodities fared poorly in the second quarter amid the easing geopolitical environment, with the Bloomberg Commodity Index down -8.1%.
Our scorecard
Our ActivePassive Scorecard shows active funds beating respective category benchmarks in eight of the 20 asset classes we tracked for the second quarter. Over the last 12 months, active funds have led our category benchmarks in eight of these analyzed asset classes.
Let’s take a look at the performance details.
U.S. equity
| Active Fund Category | Q2 Return | Vs. Benchmark | TTM Return | Vs. Benchmark |
|---|---|---|---|---|
| Large Cap Core | 13.98% | -1.16% | 19.83% | -2.19% |
| Large Cap Growth | 18.01% | 1.27% | 16.66% | -1.05% |
| Large Cap Value | 9.41% | -4.46% | 20.64% | -6.48% |
| Mid Cap Core | 14.15% | 0.32% | 6.17% | 1.12% |
| Mid Cap Growth | 16.92% | 2.37% | 14.72% | 8.55% |
| Mid Cap Value | 10.87% | -2.53% | 21.91% | -4.71% |
| Small Cap Core | 19.87% | -1.62% | 33.41% | -7.37% |
| Small Cap Growth | 24.43% | -1.28% | 33.37% | -6.37% |
| Small Cap Value | 15.97% | -1.22% | 32.84% | -10.17% |
Data from Morningstar as of June 30, 2026. The Morningstar US Active Fund categories used in this analysis represent US-domiciled mutual funds and exchange-traded funds classified as actively managed by Morningstar. The asset classes are represented by (in order of table): Russell 1000 TR USD, Russell 1000 Growth TR USD, Russell 1000 Value TR USD, Russell Mid Cap TR USD, Russell Mid Cap Growth TR USD, Russell Mid Cap Value TR USD, Russell 2000 TR USD, Russell 2000 Growth TR USD, and Russell 2000 Value TR USD.
Large cap equities delivered strong absolute returns during the quarter, led by large cap growth. Active management results were mixed, with large cap growth outperforming its benchmark, while large cap core and large cap value lagged benchmark returns. Over the trailing 12 months, benchmark exposures were more effective at capturing market gains despite positive absolute performance.
Mid cap equities represented the strongest area for active management, highlighting the value of security selection in a more dispersed market environment. Highlighting the value of security selection in a more dispersed market environment. Mid cap core posted modest quarterly outperformance but remained behind its benchmark over the trailing year. While mid cap value underperformed across both periods. Mid cap growth was the clearest example of sustained active management success over the last 12 months.
Small cap equities generated the highest absolute quarterly returns across U.S. equity styles, particularly within small cap growth and core. However, active managers lagged benchmarks in all three small cap categories during both the quarter and trailing 12-month period. The consistent shortfall versus benchmarks, despite strong absolute gains, suggests that broad market and factor exposures were difficult for active managers to overcome. Taken together, Q2 results indicate that active management added value primarily within growth-oriented segments.
Non-U.S. equity
| Active Fund Category | Q2 Return | Vs. Benchmark | TTM Return | Vs. Benchmark |
|---|---|---|---|---|
| Developed Markets | 10.46% | -0.36% | 21.20% | 0.97% |
| Emerging Markets | 22.56% | -1.49% | 44.66% | 1.15% |
Data from Morningstar as of June 30, 2026. The Morningstar US Active Fund categories used in this analysis represent US-domiciled mutual funds and exchange-traded funds classified as actively managed by Morningstar. The asset classes are represented by (in the order of table): MSCI EAFE NR USD and MSCI EM NR USD.
Developed international equities generated solid absolute returns during the quarter, though active managers modestly trailed benchmark performance by 0.36%. Despite the quarterly shortfall, active management added value over the trailing 12 months, outperforming benchmarks by 0.97%. These results suggest that while benchmark exposure was more effective in capturing near-term market gains, active managers benefited from country, sector, and security selection over the longer term.
Emerging markets were the strongest-performing non-U.S. equity segment. Active managers underperformed benchmarks in Q2, indicating that benchmark exposures captured a greater share of the market rally. However, active management added value over the longer term, outperforming by 1.15% over the trailing 12 months, highlighting the benefits of security selection and regional positioning in a diverse and rapidly evolving market environment.
Taken together, non-U.S. equity results present a mixed picture for active management. Both developed and emerging market managers lagged benchmarks during the quarter despite strong absolute returns, but each category generated positive excess returns over the trailing year. The data suggests that while benchmark exposure was advantageous during the recent rally, active management demonstrated greater value over longer measurement periods, particularly in markets characterized by varying economic and policy conditions across countries and regions.
Fixed income
| Active Fund Category | Q2 Return | Vs. Benchmark | TTM Return | Vs. Benchmark |
|---|---|---|---|---|
| Intermediate Bond | 0.74% | 0.07% | 3.80% | 0.01% |
| Short-Term Bond | 0.87% | 0.38% | 3.71% | 0.48% |
| Intermediate Muni | 2.11% | 1.04% | 6.16% | 2.35% |
| Short-Term Muni | 0.97% | 0.14% | 3.49% | 0.16% |
| High Yield | 2.46% | -0.01% | 5.71% | -0.20% |
Data from Morningstar as of June 30, 2026. The Morningstar US Active Fund categories used in this analysis represent US-domiciled mutual funds and exchange-traded funds classified as actively managed by Morningstar. The asset classes are represented by (in order of table): Bloomberg US Agg Bond TR USD, Bloomberg US Agg 1-3 Yr TR USD, Bloomberg Municipal 5 Yr 4-6 TR USD, Bloomberg Municipal 3 Yr 2-4 TR USD, Bloomberg US Corporate High Yield TR USD.
Fixed income categories generated modest positive returns during the quarter, and active management generally added value relative to benchmarks. Intermediate bond and short-term bond managers outperformed by 0.07% and 0.38%, respectively, in Q2, with both categories also maintaining slight excess returns over the trailing 12 months. While absolute returns were muted, the consistency of benchmark-relative results suggests that active duration, yield curve, and security selection decisions modestly enhanced performance.
Municipal bonds represented the strongest area for active management within fixed income. Intermediate muni managers outperformed benchmarks by 1.04% during the quarter and 2.35% over the trailing year, while short-term muni strategies also delivered positive excess returns across both periods. These results indicate that credit research, sector allocation, and issue selection provided meaningful opportunities to add value in municipal markets.
High yield bonds produced the strongest absolute returns among the fixed income categories, returning 2.46% in Q2 and 5.71% over the trailing 12 months. However, active managers slightly lagged benchmarks in both periods, suggesting that broad market exposure captured most of the gains from credit spread conditions. Overall, fixed income results were favorable for active management, with four of the five categories outperforming benchmarks during the quarter and over the trailing year, while municipal bond strategies delivered the most consistent excess returns.
Diversifying asset classes
| Active Fund Category | Q2 Return | Vs. Benchmark | TTM Return | Vs. Benchmark |
|---|---|---|---|---|
| Commodities | -6.36% | 1.72% | 25.17% | -0.29% |
| Real Estate | 10.66% | -1.71% | 14.25% | -8.34% |
| TIPS | 0.50% | -0.39% | 2.98% | -0.44% |
| Bank Loan | 1.88% | 0.00% | 4.12% | -0.24% |
Data from Morningstar as of June 30, 2026. The Morningstar US Active Fund categories used in this analysis represent US-domiciled mutual funds and exchange-traded funds classified as actively managed by Morningstar. The asset classes are represented by (in order of table): Bloomberg Commodity TR USD, DJ US Select REIT TR USD, BBgBarc US Treasury US TIPS TR USD, and Morningstar LSTA LL TR USD.
Diversifying asset classes delivered mixed absolute returns during the quarter, and active management generally struggled to maintain consistent benchmark outperformance. Commodities were the notable exception, as active managers outperformed benchmarks despite a negative absolute return, suggesting that active positioning helped mitigate downside pressure. Suggesting that active positioning helped mitigate downside pressure. However, the category slightly underperformed over the trailing 12 months, indicating that benchmark exposure remained competitive over longer periods.
Real estate generated solid absolute returns during the quarter and over the trailing year, but active managers lagged benchmarks significantly in both periods.
Other income-oriented diversifying asset classes also faced challenges. TIPS underperformed benchmarks during both the quarter and trailing year, while bank loan managers matched their benchmark in Q2 and modestly trailed over the trailing 12 months. Taken together, results across diversifying asset classes indicate that active management added value in only a limited number of areas, with commodities standing out as the sole category to generate meaningful quarterly excess returns. In most categories, benchmark exposure proved difficult to overcome despite generally positive absolute performance.
Factor update
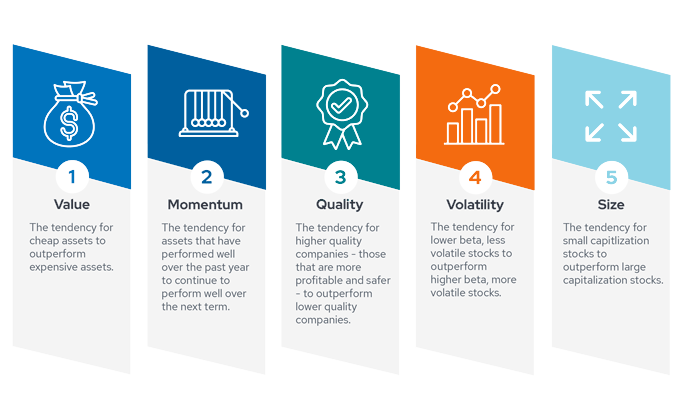
Below, we examine the performance of the five key factors (described by the infographic above) in the current market environment. This analysis is relevant to our scorecard because factors are integral to many active management strategies.
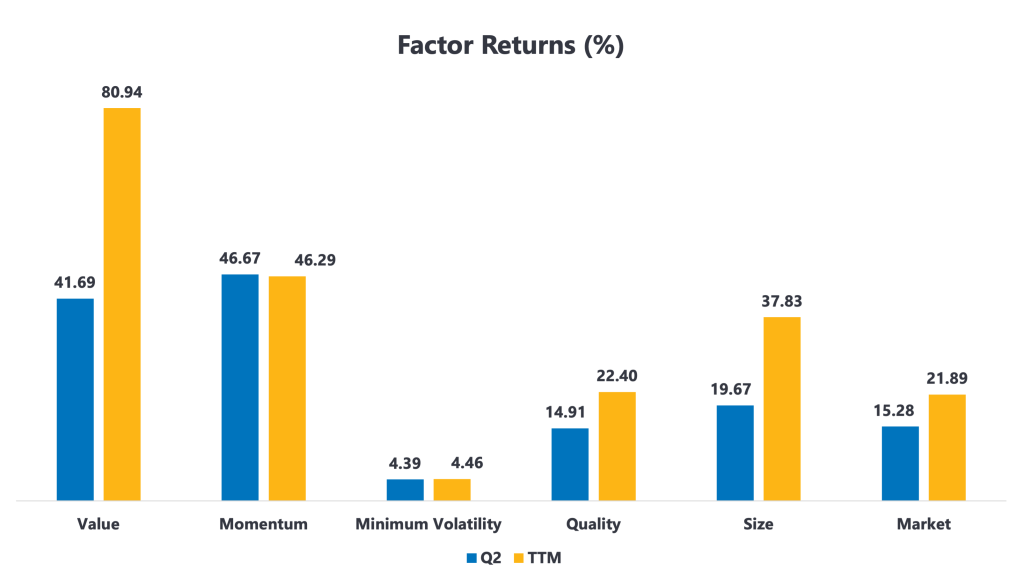
Data from Morningstar as of June 30, 2026. These indices represent U.S. factor returns: MSCI USA Enhanced Value, MSCI USA Momentum, MSCI USA Minimum Volatility, MSCI USA Quality, MSCI USA Small Cap, and MSCI USA GR USD.
- Value was the standout factor, generating the highest returns over both periods, with particularly strong trailing twelve-month performance. This suggests investors continued to reward attractively valued companies amid a broadening market rally.
- Momentum remained a top performer, delivering nearly identical returns in Q2 and over the trailing twelve months, while Quality, Market, and Size produced solid positive gains and accelerated over the longer-term period.
- Minimum Volatility was the weakest-performing factor, posting the lowest returns across both time horizons, indicating that investor preference remained tilted toward higher-beta and cyclical exposures rather than defensive strategies.
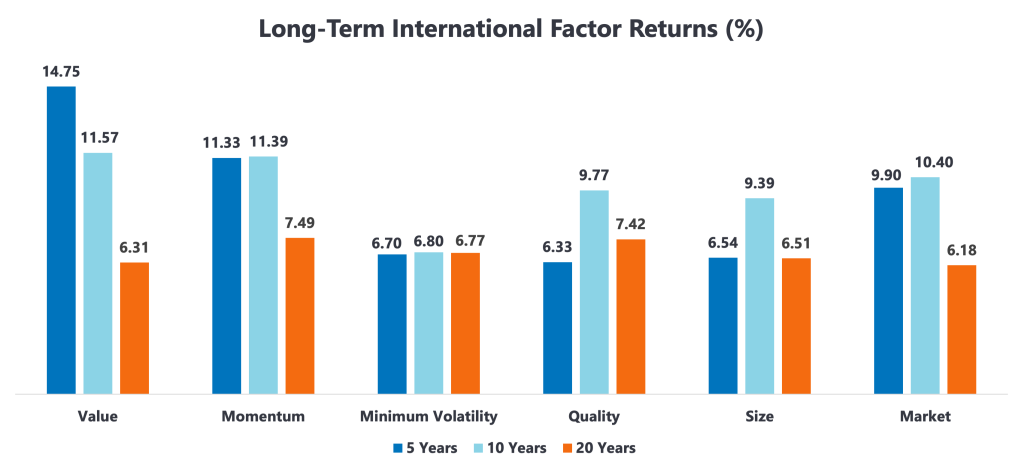
Data from Morningstar as of June 30, 2026. These indices represent international factor returns: MSCI ACWI Ex-US Momentum, MSCI ACWI Ex-US Enhanced Value, MSCI ACWI Ex-US Quality, MSCI ACWI Ex-US Small Cap, MSCI ACWI Ex-US Minimum Volatility, and MSCI ACWI Ex-US GR USD.
- Value, momentum and market have shown long-term effectiveness in international markets despite varying market environments.
- Minimum Volatility exhibited the most consistent return profile, whereas other factors experienced more variation in outcomes depending on the investment horizon.
- We believe the absence of a single dominant factor across all periods reinforces the case for diversified factor allocations, allowing portfolios to participate in changing market leadership while reducing reliance on any one investment style.
Value in both active and passive management
This update on active and passive management covers a relatively short timeframe, but Envestnet | PMC has a long history of research and portfolio management using our ActivePassive methodology. This framework requires patience and a deep understanding of cyclical trends. Ultimately, though, we believe there are places and times for both active and passive management.
Learn more about ActivePassive investing.