Envestnet | PMC is an industry pioneer in blending the two opposing investment styles: active and passive. We have been implementing this approach within client portfolios well before the asset flow dominance into passive vehicles in recent years. We leverage Envestnet | PMC’s core competencies of manager research and due diligence, manager selection, asset allocation, and active/passive research to engage with our clients. We know active management is cyclical, but we are firm advocates of active strategies. We recognize the benefits of passive investing, too.
Market overview
The first quarter of 2026 was defined by the abrupt onset of a U.S./Israel-Iran military conflict, which began on February 28 with coordinated airstrikes targeting Iranian nuclear facilities, missile sites, and senior leadership. The campaign killed Supreme Leader Ali Khamenei in its opening hours and prompted Iran to close the Strait of Hormuz, marking the largest disruption to seaborne energy supply since the 1970s. Brent crude prices surged more than 77% in March, comparable to some of the most significant oil shocks in history, abruptly reversing an early-quarter risk-on environment and driving a synchronized market selloff.
Volatility rose sharply as investors assessed geopolitical risk, rapid advancements in artificial intelligence, and mounting concerns around private credit. U.S. equities recorded the worst quarterly performance in nearly two years, with the S&P 500 declining 4.33%. The decline was driven primarily by a steep March drop of 4.98%, following a modest gain in January (+1.45%) and a flat February (-0.76%). The Magnificent 7 accounted for nearly 90% of the index’s quarterly drawdown amid concerns over software disruption and skepticism around AI-related capital expenditures. Beneath the surface, however, market leadership broadened meaningfully, with value, small cap, and mid cap stocks posting positive returns for the quarter. The US dollar, which had begun strengthening in February, rallied further in March, supported by safe-haven demand and higher commodity prices. While international equities lagged U.S. markets during March due to greater exposure to energy supply disruptions, they outperformed over the full quarter. Rising inflation pressures and the anticipated global supply shock left major central banks in a wait-and-see stance. The Federal Reserve maintained the federal funds target range at 3.50%–3.75% at the March 18 FOMC meeting, marking a second consecutive hold, following the initial pause in December 2025.
Market expectations shifted notably, with CME FedWatch pricing in virtually no rate cuts for 2026 by quarter-end, down from roughly two expected cuts at the start of the period. Treasury yields rose across the curve as inflation expectations repriced higher, with the 10-Year yield ending the quarter at 4.30% (+12 bps). The Bloomberg US Aggregate was essentially flat (-0.05%) but failed to provide ballast in March, declining 1.76% alongside equities. Despite widening credit spreads, both high-yield and investment-grade bonds finished the quarter broadly in line, while global bonds underperformed U.S. fixed income, largely due to rising rates and U.S. dollar strength. Commodities were among the best-performing asset classes in Q1 2026, supported primarily by the energy sector.
Our scorecard
Our ActivePassive Scorecard shows active funds beating our category benchmarks in 10 of the 20 asset classes we tracked for the first quarter.
Over the last 12 months, active funds have led our category benchmarks in 6 of these analyzed asset classes.
Let’s take a look at the performance details.
U.S. equity
| Active Fund Category | Q1 Return | Vs. Benchmark | TTM Return | Vs. Benchmark |
|---|---|---|---|---|
| Large Cap Core | -3.92% | 0.26% | 15.45% | -2.29% |
| Large Cap Growth | -8.68% | 1.10% | 16.02% | -2.79% |
| Large Cap Value | 1.39% | -0.71% | 14.94% | -0.93% |
| Mid Cap Core | 1.13% | -0.17% | 15.05% | -0.93% |
| Mid Cap Growth | -4.42% | 1.93% | 12.12% | 2.56% |
| Mid Cap Value | 1.90% | -1.78% | 14.43% | -3.20% |
| Small Cap Core | 1.52% | 0.64% | 18.88% | -6.85% |
| Small Cap Growth | -2.39% | 0.42% | 17.61% | -5.97% |
| Small Cap Value | 3.55% | -1.41% | 19.81% | -8.29% |
Data from Morningstar as of March 31, 2026. The Morningstar US Active Fund categories used in this analysis represent US-domiciled mutual funds and exchange-traded funds classified as actively managed by Morningstar. The asset classes are represented by (in order of table): Russell 1000 TR USD, Russell 1000 Growth TR USD, Russell 1000 Value TR USD, Russell Mid Cap TR USD, Russell Mid Cap Growth TR USD, Russell Mid Cap Value TR USD, Russell 2000 TR USD, Russell 2000 Growth TR USD, and Russell 2000 Value TR USD.
Large cap equities faced broad pressure during the quarter, particularly within growth-oriented strategies, as market leadership narrowed and investors reassessed valuation sensitivity amid shifting rate expectations. Despite weak absolute results, active management generally helped mitigate downside risk in large cap core and growth portfolios through stock selection and risk control, while value strategies lagged as benchmark exposures were more effective at capturing factor driven gains. Overall, large cap results suggest that manager decisions added value primarily through downside management rather than return generation.
Mid cap equities showed clearer differentiation between styles and a more favorable environment for active management, especially within growth. Volatility created opportunities for stock selection, allowing active managers to better navigate dispersion across sectors and individual companies. In contrast, mid cap value and core strategies struggled to overcome benchmark exposures, as factor led performance reduced the effectiveness of active tilts during the quarter.
Small cap equities delivered mixed outcomes, with value-oriented portfolios posting stronger absolute performance but struggling to keep pace with benchmarks, reflecting concentrated factor leadership. Active strategies were more effective in small cap growth and core segments, where manager flexibility and security selection helped cushion declines and slightly outperform broad market exposures. Taken together, Q1 trends indicate that active management was most effective in volatile, growth-oriented areas of the market, while benchmark exposure remained difficult to overcome in segments dominated by narrow factor leadership.
Non-U.S. equity
| Active Fund Category | Q1 Return | Vs. Benchmark | TTM Return | Vs. Benchmark |
|---|---|---|---|---|
| Developed Markets | 0.10% | 1.34% | 22.54% | 1.27% |
| Emerging Markets | 2.99% | 3.15% | 31.01% | 3.46% |
Data from Morningstar as of March 31, 2026. The Morningstar US Active Fund categories used in this analysis represent US-domiciled mutual funds and exchange-traded funds classified as actively managed by Morningstar. The asset classes are represented by (in the order of table): MSCI EAFE NR USD and MSCI EM NR USD.
Developed markets delivered relatively muted absolute results during the quarter, but active management proved effective despite a challenging backdrop. Market leadership was uneven across regions, with currency movements and sector dispersion playing a larger role than broad market direction. Active managers benefited from country and sector selection, allowing them to better navigate differences in economic momentum and valuation sensitivity across developed markets, resulting in consistent relative outperformance versus benchmarks.
Emerging markets experienced a stronger performance environment, supported by improving growth expectations and more favorable investor sentiment toward select regions. Elevated volatility and dispersion across countries, sectors, and currencies created a particularly favorable setting for active management, where security selection and regional positioning added meaningful value. Overall, Q1 trends reinforced emerging markets as an asset class where active management has the potential to outperform, especially when macro and policy dynamics diverge across countries.
Fixed income
| Active Fund Category | Q4 Return | Vs. Benchmark | TTM Return | Vs. Benchmark |
|---|---|---|---|---|
| Intermediate Bond | -0.06% | -0.01% | 4.25% | -0.10% |
| Short-Term Bond | 0.18% | -0.15% | 4.40% | 0.36% |
| Intermediate Muni | -0.11% | -0.12% | 4.30% | 0.21% |
| Short-Term Muni | 0.34% | -0.13% | 3.39% | -0.16% |
| High Yield | -0.47% | 0.03% | 6.56% | -0.45% |
Data from Morningstar as of March 31, 2026. The Morningstar US Active Fund categories used in this analysis represent US-domiciled mutual funds and exchange-traded funds classified as actively managed by Morningstar. The asset classes are represented by (in order of table): Bloomberg US Agg Bond TR USD, Bloomberg US Agg 1-3 Yr TR USD, Bloomberg Municipal 5 Yr 4-6 TR USD, Bloomberg Municipal 3 Yr 2-4 TR USD, Bloomberg US Corporate High Yield TR USD.
Core and short duration taxable bonds faced a challenging quarter as shifting rate expectations and modest yield curve movement limited opportunities for excess return. Active strategies struggled to overcome benchmark exposure in intermediate bonds, where duration positioning and security selection provided limited differentiation. Short term taxable bonds proved more supportive for active management, as carry, yield discipline, and incremental positioning helped offset tighter spreads and delivered better relative outcomes, highlighting the importance of flexibility.
Municipal bonds and high yield showed mixed results, underscoring how credit selection and sector exposure influenced outcomes across income-oriented categories. Municipal strategies benefited from stable credit fundamentals but struggled to consistently add value versus benchmarks. High yield presented a more favorable backdrop for active management during the quarter, as credit selection helped managers navigate issuer level differences amid ongoing spread compression. Overall, fixed income trends reinforced that active management was most effective in areas with greater dispersion and structural complexity.
Diversifying asset classes
| Active Fund Category | Q4 Return | Vs. Benchmark | TTM Return | Vs. Benchmark |
|---|---|---|---|---|
| Commodities | 20.54% | -3.87% | 31.32% | -0.97% |
| Real Estate | 2.77% | -1.87% | 2.35% | -4.88% |
| TIPS | 0.71% | 0.44% | 3.52% | 0.52% |
| Bank Loan | -0.49% | 0.07% | 4.49% | -0.32% |
Data from Morningstar as of March 31, 2026. The Morningstar US Active Fund categories used in this analysis represent US-domiciled mutual funds and exchange-traded funds classified as actively managed by Morningstar. The asset classes are represented by (in order of table): Bloomberg Commodity TR USD, DJ US Select REIT TR USD, BBgBarc US Treasury US TIPS TR USD, and Morningstar LSTA LL TR USD.
Commodities and real estate produced mixed outcomes, highlighting the challenges of active management in more benchmark-driven or structurally constrained segments. Commodities delivered strong absolute performance, but active strategies struggled to keep pace with benchmarks, suggesting that broad commodity beta captured much of the return as price moves were driven by macro and supply/demand dynamics. Real estate also lagged its benchmark, reflecting continued sensitivity to interest rates and financing conditions, where concentrated index exposures and limited dispersion across property types made relative outperformance difficult for active managers.
TIPS (Treasury Inflation Protected Securities) and bank loans, by contrast, provided a more supportive environment for active management, benefiting from income-oriented characteristics and greater opportunity for positioning. TIPS outperformance relative to benchmarks reflected effective inflation sensitive exposure and maturity positioning, while bank loans modestly exceeded benchmarks during the quarter as security selection helped offset a more challenging return backdrop. Overall, results across diversifying asset classes reinforced a familiar theme: active management tended to be more effective in areas with structural complexity and security‑level return dispersion, while benchmark exposure remained difficult to overcome in asset classes driven primarily by broad macro forces.
Factor update
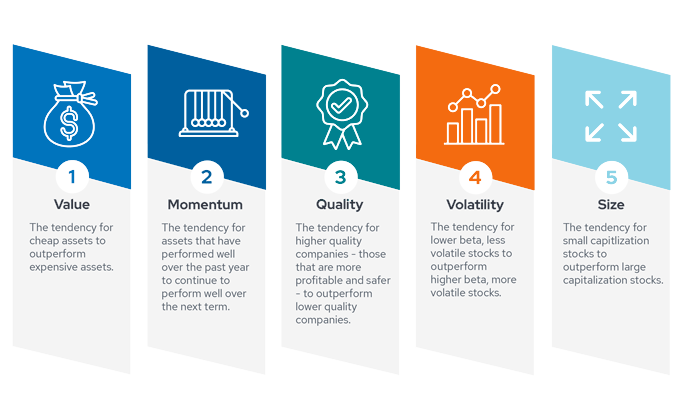
Below, we examine the performance of the five key factors (described by the infographic above) in the current market environment. This analysis is relevant to our scorecard because factors are integral to many active management strategies.
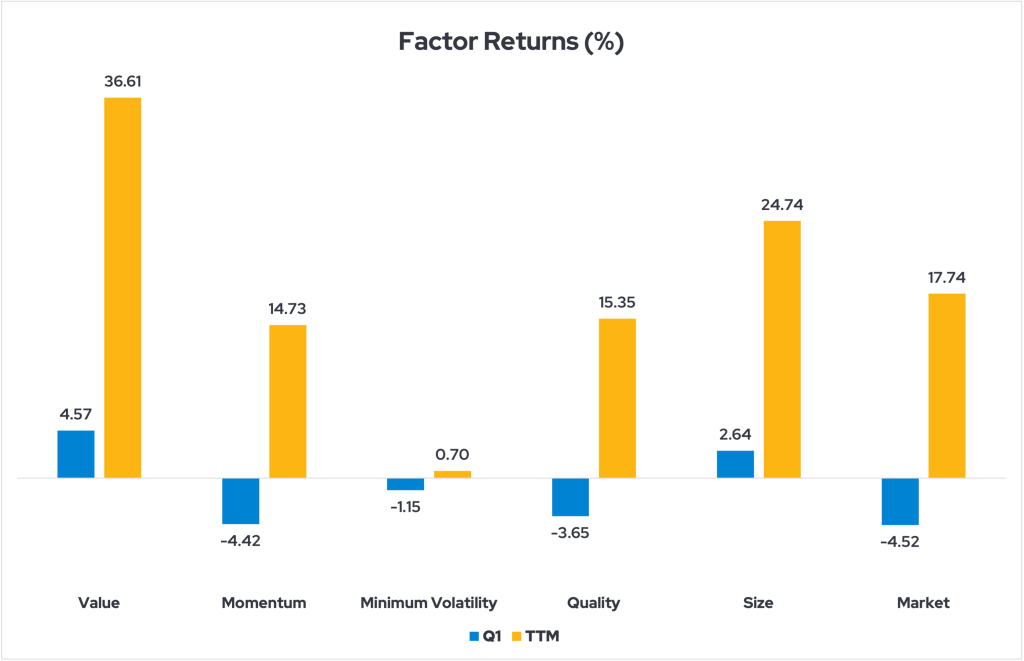
Data from Morningstar as of March 31, 2026. These indices represent U.S. factor returns: MSCI USA Enhanced Value, MSCI USA Momentum, MSCI USA Minimum Volatility, MSCI USA Quality, MSCI USA Small Cap, and MSCI USA GR USD.
- Value was the clear leader, posting strong gains in both the quarter and over the trailing twelve months, reinforcing its continued dominance as one of the most effective equity factors in the current environment.
- Momentum, quality, and minimum volatility lagged, particularly in the near term, reflecting a market environment that favored cyclical and valuation-driven factors over defensive and trend-based styles.
- Size managed to perform well, with small cap exposure delivering solid longer-term returns and positive momentum, suggesting investor appetite has broadened beyond mega cap leadership.
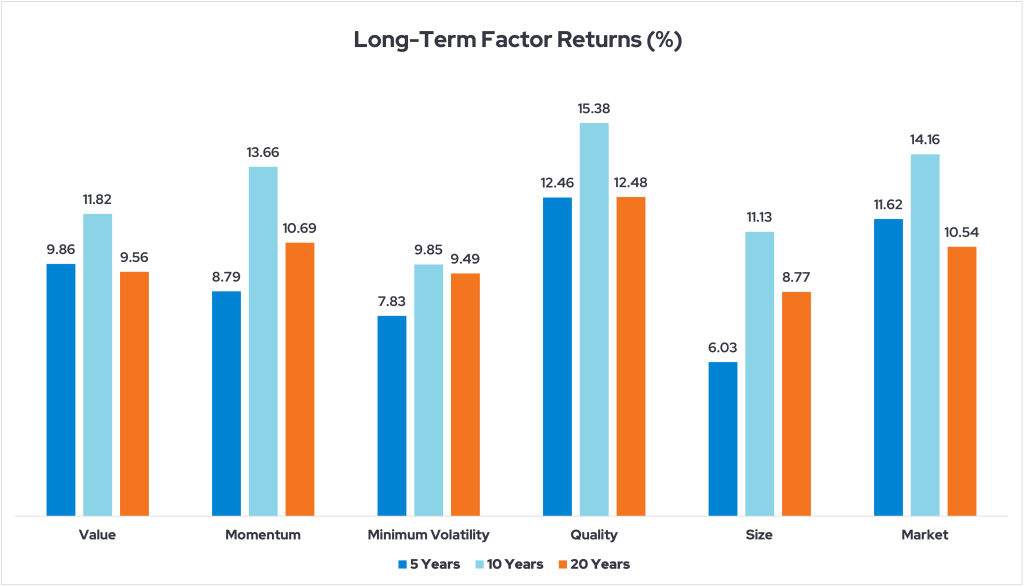
Data from Morningstar as of March 31, 2026. These indices represent international factor returns: MSCI ACWI Ex-US Momentum, MSCI ACWI Ex-US Enhanced Value, MSCI ACWI Ex-US Quality, MSCI ACWI Ex-US Small Cap, MSCI ACWI Ex-US Minimum Volatility, and MSCI ACWI Ex-US GR USD.
- Quality stands out for exhibiting comparatively consistent strength across multiple horizons, whereas Value, Momentum, and Size show more variability in their outcomes depending on the measurement window.
- This contrast illustrates the difference between factors with more persistent characteristics and those that appear more cyclically driven.
- Minimum Volatility displays a distinct return pattern that favors consistency, aligning more closely with defensive or stabilizing behavior than with long-run return dominance.
- Taken together, the chart underscores how different factors can play complementary roles when evaluated alongside passive market exposure.
Value in both active and passive management
This update on active and passive management covers a relatively short timeframe, but Envestnet | PMC has a long history of research and portfolio management using our ActivePassive methodology. This framework requires patience and a deep understanding of cyclical trends. Ultimately, though, we believe there are places and times for both active and passive management.
Learn more about ActivePassive investing.