In a stunning turn of events, 2023 defied the gloomy forecasts of economists and market participants, who had anticipated a looming recession and a bear market. Contrary to expectations, the U.S. economy expanded in every quarter of 2023 and the equity market staged an impressive rally, surging by more than 20%. Despite grappling with significant challenges, such as the worst banking crisis since 2008, rapid Fed rate hikes, debt ceilings, budget battles in Washington, the ongoing war in Ukraine, conflicts in the Middle East, concerns over China's economy, and a deeply inverted yield curve, the markets displayed remarkable strength. The last two months of the fourth quarter witnessed robust performance across most asset classes, with U.S. equities leading the way and outperforming international markets.
Despite initial struggles, smaller-cap stocks rebounded strongly in the final nine weeks of the year, surpassing their large-cap counterparts. Growth outperformance returned, with growth equities outperforming value by a wide margin. The Federal Reserve (Fed) left rates unchanged at 5.25% to 5.5% at its December meeting, and the Fed also hinted that rates are at their cycle peak. After trending higher for most of October, the 10-year Treasury yield reversed course in the last two months of the year, dropping sharply to a level of 3.88% at the end of December. This moderation in interest rates spurred a recovery in bond prices, especially for longer-dated issues. The weakening U.S. dollar contributed to the outperformance of global bonds over domestic fixed income. The combination of falling interest rates and tightening corporate credit spreads favored investment-grade bonds over high yield. Commodities stood out as one of the few asset classes posting negative performance, attributed to softness in energy prices.
Pioneers in blending active and passive strategies
Envestnet | PMC is an industry pioneer in blending the two opposing investment styles: active and passive. We have been implementing this approach long before the craze of ETFs and the asset flow dominance into passive vehicles in recent years. This investment methodology is in our DNA. We leverage Envestnet | PMC’s core competencies of manager research and due diligence, manager selection, asset allocation, and active/passive research to engage with our clients. We know that active management is cyclical, but we are firm advocates of active management. We also recognize the multiple benefits of passive investing. Ultimately, we are believers in both investment styles.
Q4 2023 ActivePassive® Scorecard assessment
Q4 proved to be a tough period for active managers of equity funds—only large cap value managers eked out aggregate outperformance. Active equity managers struggled to beat growth stock benchmarks in 2023 due to the concentration of gains in a handful of stocks, but active managers with a value focus outperformed their passive benchmarks in 2023 despite mixed Q4 results. Small cap value managers led the equity asset classes in terms of 2023 outperformance. Note that less efficient small cap markets can yield more security selection opportunities for active managers to exploit. When reviewing international equities, we saw that emerging markets managers continued their benchmark-topping success in the fourth quarter.
In fixed income, we saw mixed active management outperformance for Q4 as interest rates dropped sharply. For 2023, though, we saw active management outperformance across four of the five fixed income asset classes tracked for this scorecard. The volatile interest rate environment seen throughout the year enabled nimble bond managers to excel. Only high yield managers failed to generate overall benchmark-topping returns in 2023.
Diversifying asset classes posted mixed results for active managers in Q4; funds in just two of five asset classes in this category delivered quarterly outperformance. When we step back and look at 2023 in totality, we find that only active commodities managers delivered full-year outperformance. (Commodities represent the only asset class tracked for this report that posted negative returns for 2023 or Q4.)
Overall, the 2023 saw active managers record aggregate success in 43% of the asset classes tracked for this scorecard.
U.S. Equity
| Active Fund Category | Qtr Return | Vs. Benchmark | 2023 Return | Vs. Benchmark |
|---|---|---|---|---|
| Large Cap Core | 11.24% | -0.72% | 21.79% | -4.74% |
| Large Cap Growth | 13.94% | -0.23% | 36.88% | -5.80% |
| Large Cap Value | 9.54% | 0.04% | 11.76% | 0.29% |
| Mid Cap Core | 11.30% | -1.52% | 15.93% | -1.30% |
| Mid Cap Growth | 12.39% | -2.16% | 21.35% | -4.51% |
| Mid Cap Value | 11.18% | -0.93% | 14.12% | 1.40% |
| Small Cap Core | 12.25% | -1.78% | 16.28% | -0.65% |
| Small Cap Growth | 11.37% | -1.38% | 16.69% | -1.97% |
| Small Cap Value | 12.44% | -2.82% | 16.58% | 1.94% |
Non-U.S. Equity
| Active Fund Category | Qtr Return | Vs. Benchmark | 2023 Return | Vs. Benchmark |
|---|---|---|---|---|
| Developed Markets | 9.75% | -0.67% | 16.05% | -2.19% |
| Emerging Markets | 7.89% | 0.02% | 12.32% | 2.50% |
Fixed Income
| Active Fund Category | Qtr Return | Vs. Benchmark | 2023 Return | Vs. Benchmark |
|---|---|---|---|---|
| Intermediate Bond | 6.44% | -0.38% | 5.59% | 0.07% |
| Intermediate Muni | 6.36% | 1.14% | 5.59% | 1.29% |
| Short-Term Bond | 3.30% | 0.59% | 5.75% | 1.10% |
| High Yield | 6.09% | -1.07% | 11.97% | -1.48% |
| Global Bond | 7.85% | -1.37% | 6.50% | 0.78% |
Diversifying Asset Classes
| Active Fund Category | Qtr Return | Vs. Benchmark | 2023 Return | Vs. Benchmark |
|---|---|---|---|---|
| TIPS | 3.06% | -1.65% | 2.19% | -1.71% |
| Emerging Markets Bond | 8.33% | -0.30% | 10.81% | -1.11% |
| Commodities | -3.83% | 0.80% | -6.24% | 1.68% |
| Real Estate | 15.48% | -0.87% | 12.07% | -1.89% |
| Bank Loan | 2.95% | 0.08% | 12.20% | -1.12% |
Data from Morningstar as of 12/31/2023. Morningstar US Active Fund categories used in this analysis represent US-domiciled mutual funds and exchange-traded funds classified as actively managed by Morningstar. Asset classes represented by (in order of table): Russell 1000 TR USD, Russell 1000 Growth TR USD, Russell 1000 Value TR USD, Russell Mid Cap TR USD, Russell Mid Cap Growth TR USD, Russell Mid Cap Value TR USD, Russell 2000 TR USD, Russell 2000 Growth TR USD, Russell 2000 Value TR USD, MSCI EAFE NR USD, MSCI EM NR USD, Bloomberg Commodity TR USD, DJ US Select REIT TR USD, Bloomberg US Agg Bond TR USD, Bloomberg Municipal 5 Yr 4-6 TR USD, Bloomberg US Agg 1-3 Yr TR USD, Bloomberg US Corporate High Yield TR USD, Bloomberg Gbl Agg Ex USD TR USD, BBgBarc US Treasury US TIPS TR USD, 50% JPM GBI-EM GD and 50% JPM EMBI GD, Bloomberg Commodity TR USD, DJ US Select REIT TR USD, Morningstar LSTA LL Index TR USD.
Factor updates
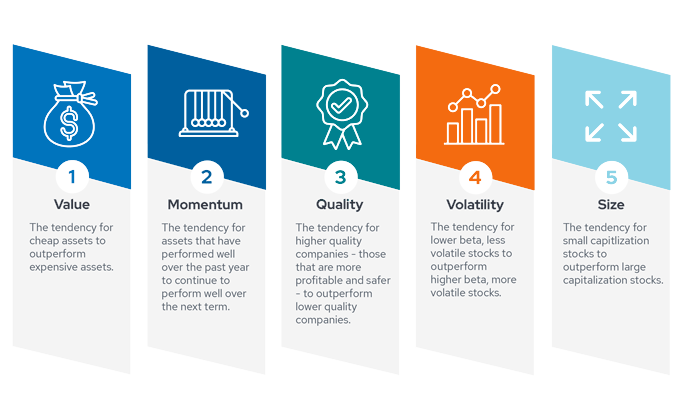
The performance of factors can significantly impact active manager success, especially because factors are deeply intertwined with investment approaches and styles. Factors are thus very relevant to this scorecard. Rewarded risk factors are also widely recognized as fundamental components of equity returns. Envestnet | PMC believes that the most robust among the studied risk factors are Value, Momentum, Quality, Low Volatility, and Size. Like all return components, though, factors are cyclical in nature.
Below, we examine the performance of six factors in the current market environment. (Note that the Growth factor can be viewed as the inverse of the Value factor in its construction.)

U.S. factor returns are represented by the MSCI USA Momentum, MSCI USA Enhanced Value, MSCI USA Quality, MSCI USA Small Cap, MSCI USA Growth, and MSCI USA Minimum Volatility indices. Market: MSCI USA GR USD. Data source: Morningstar.
- All the factors that we track for this scorecard rose in the fourth quarter, illustrating the breadth of U.S. equity market strength during the quarter. Factor performance still remains cyclical, which is true for all types of assets, as factors bear the effects of both the macroeconomic, business, and sentiment cycles. Factors don’t rise and fall uniformly.
- Size was the best-performing factor in Q4 while Minimum Volatility was the laggard. Small cap companies have been facing pressure from higher interest rates, but the falling interest rates during Q4 have helped to reinvigorate the Size factor.
- In 2023, Quality and Growth were the strongest factors. Growth has shown a strong rebound from 2022, but Minimum Volatility was the 2023 straggler. The return of strong Growth performance following a year when Value excelled has been detrimental to the Momentum fact
- Note that the Market factor is equivalent to beta in this analysis. We use the MSCI USA index to represent the Market factor.or, though. Big tech stocks are becoming increasingly associated with the Quality factor, and they performed well for the year.
Value in both active & passive management
This update on active and passive management covers a relatively short timeframe, but Envestnet | PMC has a long history of research and portfolio management using our ActivePassive™ methodology. This framework requires patience and a deep understanding of cyclical trends. Ultimately, we believe there is a place and time for both active and passive management.
For more information on Envestnet | PMC, please visit www.investpmc.com