June continued the positive momentum from May and even saw the gains broaden further. The S&P 500’s final two trading days in June yielded consecutive record highs. Non-U.S. stock markets also continued to climb, and emerging markets rose by just over 6% to lead the way higher in June. Developed markets added another 2.2% as well. Bond markets generally delivered gains.
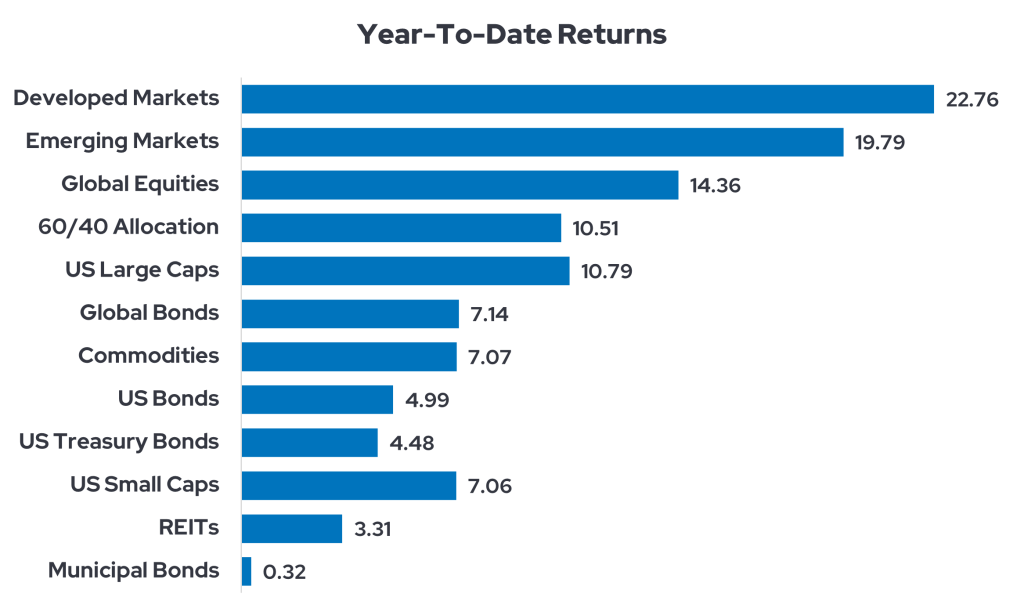
Equities largely enjoyed another month of solid gains in July, although developed market stocks dipped 1.4% following a strong first half of the year. U.S. large caps and emerging market shares led the way as trade tensions eased somewhat. U.S. small caps also made headway in July. Small caps remained down slightly for the year, though, as loftier interest rates tend to burden companies that aren’t behemoths. All the fixed income asset classes we track for our monthly recap lost ground in July, as did REITs (Real Estate Investment Trusts) and commodities. The stubbornly high rates mentioned above hurt bond and real estate prices. Commodities wavered as gold prices dipped, and copper prices plummeted—the latter due to tariff adjustments. And then came August.
Tariffs and interest rates
Instead of discussing each of the myriad tariffs announced for August 1st, we suggest reviewing Bloomberg's Tariff Tracker. Ultimately, though, the announced tariffs were largely in line with expectations. Switzerland may be the biggest surprise loser among the group, with a 39% tariff applied to its exports. Canada and India were also affected, but most imports from Canada still fall under the USMCA trade agreement and face no tariffs. (The same is true for Mexico.) Canada's effective tariff rate is just above 6%, not the 35% often quoted. India suddenly finds itself on the wrong side of Trump's potentially souring relationship with Putin and has yet to negotiate a favorable trade deal.
Stocks around the globe had been due for a temporary breather following several generally strong weeks of gains. Tariffs and the Fed offered opportunities for investors to take some profits, but the positive ADP report on private employment and rumblings of a grand trade deal with China presaged a nice August 1st. And then the U.S. payrolls data for July was released, revealing massive downward revisions to previous employment data. Trump fired the Labor Department's chief statistician, and the wheels briefly fell off the stock market.
Instead of the 100,000+ net new jobs that economists expected to be added in July, only 73,000 jobs were created (mostly in healthcare, social services, and finance). This miss doesn't seem awful, right? The problem is that 258,000 job additions were removed following revisions to previous months. The unemployment rate also bumped up to 4.2%.
Last year, we also experienced a dramatic late-summer revision of employment data, which prompted the Fed to cut rates by 50 bps in September, 25 bps in November, and again in December. Will we see the same response again? Wall Street doesn’t think the Fed will cut by 50 bps in September 2025, but it is much more likely that Powell and Company trim rates by 25 bps at the next Fed meeting.
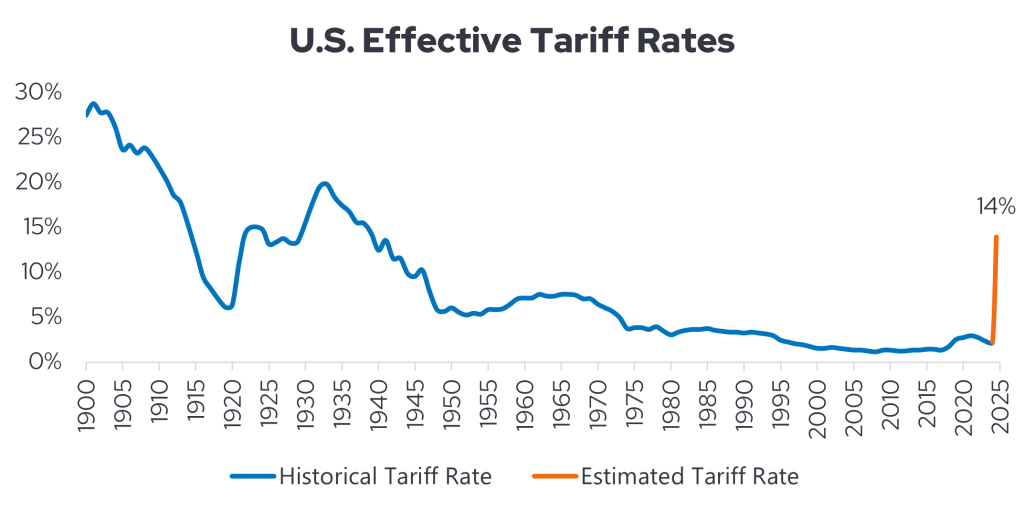
The S&P 500 dropped 1.6% following the August 1st payroll report, and the VIX (the stock market fear gauge) jumped 21.89%! Bonds also rallied as Fed rate cuts now look much more likely. Gold closed higher on August 1st, too. U.S. equities recovered quickly, though. Reasonably positive Consumer Price Index data was reported on August 12th, which supported U.S. stocks and bonds mid-month. The CPI rose 0.2% on a monthly basis in July, which was in line with the consensus forecast. It also rose 2.7% y/y, which was slightly less than the consensus forecast. The core CPI increased 0.3% month-over-month (m/m) in July, as expected, and rose 3.1% year-over-year (y/y), just above the 3% consensus estimate. Overall, the top-line numbers were not very surprising. Here's the surprise: Core Goods prices rose by only 0.2% last month, and at a microscopically higher rate than in June. What about tariffs, though? Well, it's hard to detect them climbing too much in the goods inflation data, even though tariffs have bumped upward all summer. Look for tariffs to flow more strongly in the August data as duties ratcheted even higher on the 1st of the month. We’re still forecasting a final effective tariff rate around 14%.
A market look ahead
We don't think the U.S. economy is careening into a recession this year, but the Federal Reserve will likely cut rates in September and again at least once more in 2025 (and maybe twice more). This may seem like an opportune time to lengthen bond portfolio duration slightly and capture potential bond appreciation from falling interest rates, but be cautious. There's no reason to go too far because long-term U.S. rates are facing a lift from other forces. The Fed has a significantly greater impact on 2-year rates than on 20-year rates. Imagine staking a lengthy piece of fabric to the ground: Driving the stake down farther will lower the fabric close to it, but the wind can still blow around material twenty feet away to pull it upward. The same is true when the Fed drives down short-term rates but fails to pin down the long, fluctuating tail of the yield curve. Municipal bond yields remain attractive across the yield curve, though.
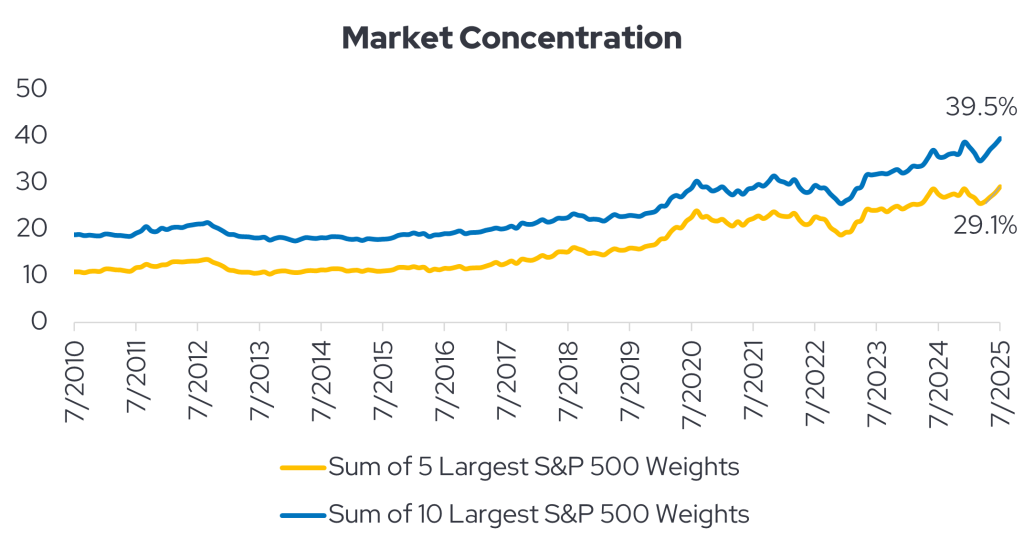
As for stocks, we don’t recommend underweighting U.S. large cap growth stocks given their impressive earnings growth and hefty cash flows. These companies are far healthier than the tech businesses involved in the dot-com bust of 2000. That said, large tech stocks are richly valued and have contributed to significant market concentration in the S&P 500. The biggest five companies by market cap comprise 29.1% of the index’s weighting, according to Strategas as of July 31st. The other 495 constituents comprise the other 70.9%. Given this fact, we don’t recommend overweighting portfolios toward technology shares.
We continue to encourage international diversification, but we also want to highlight small cap U.S. stocks because portfolios may be underweight these shares. Small caps led equities higher the week of August 18th, with the Russell 2000 up over 3.2%. While small caps have continued to lag behind large caps in the U.S. for the year, they have risen recently due to expectations of rate cuts. In particular, small caps surged following Federal Reserve Chairman Jerome Powell’s speech to close the Fed’s annual Jackson Hole Economic Policy Symposium. In contrast to his somewhat hawkish tone at the press conference after July’s Fed meeting, Chairman Powell was quite dovish in his speech in Jackson Hole on August 22nd. While reiterating upside risks to inflation, Chairman Powell focused his speech primarily on downside risks to employment instead of upside risks to inflation. In conclusion, he stated, “Nonetheless, with policy in restrictive territory, the baseline outlook and the shifting balance of risks may warrant adjusting our policy stance.” These remarks led investors to believe that a September rate cut is highly likely to occur. The market now assigns a 100% chance of a September policy change, well above its estimate from July 31st.1
Why did one speech send small caps higher? Recall that small caps (unlike large corporations) frequently have floating-rate debt instead of traditional bonds paying fixed coupons. For this reason, Fed interest rate cuts would quickly benefit small cap profitability at the net income level. Since a significant percentage of U.S. small cap companies are currently unprofitable—32% of them according to a February analysis by MarketWatch and Morningstar—this area of the market needs help breaking even.2 The Russell 2000 thus remains below its all-time high set in November 2021. While the S&P 500 has regularly notched record highs since 2021, domestic small caps can't seem to gain sustainable traction. Significant rate cuts could help the Russell 2000 move higher, though. With a price-to-earnings ratio of 17.3 for the Russell 2000 versus 26.6 for the S&P 500, small caps have much lower valuations than their larger counterparts.3
Keep calm and stay diversified
Overall, markets are entering the fall with a mix of opportunities and uncertainties. Equity strength has been broad, though concentrated leadership and trade frictions remain in play, while bonds are set to benefit if the Fed follows through with anticipated rate cuts. Tariffs and employment trends will continue to shape sentiment in the months ahead. Still, with valuations more attractive in certain corners—such as small caps and international equities—investors have reason to stay engaged and diversified. The path forward is unlikely to be linear, yet for disciplined investors, these shifts may create compelling entry points as monetary policy and global growth dynamics evolve.
For more information on Envestnet | PMC, please visit www.investpmc.com.