According to Bloomberg data, US passive fund assets overtook active fund assets for the first time in October 2023.1 This inflection point didn’t slow the shift toward passive strategies, either. Bloomberg indicates that 51% of US fund assets are currently invested in passively managed products.2 While Cerulli recently noted that active mutual funds have been the biggest asset losers in recent years,3 we want to focus on ETFs in this blog post. The ETF wrapper is steadily gaining assets and is seeing strong product development. To deliver advisor-centric insights, let’s examine the asset breakdown and flows into active and passive ETFs by leveraging insights from the Envestnet platform.
Active and passive ETF asset breakdown
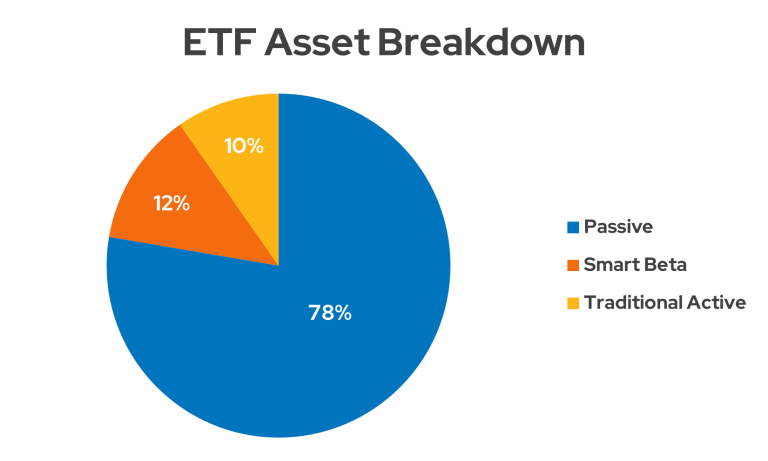
First, let’s examine this topic from a high level. As the chart below illustrates, passive products still dominate the ETF landscape and hold over ¾ of the ETF assets managed through the Advisor Managed and UMA programs on the Envestnet platform. When ranked by total assets, the ten largest ETFs on the platform are passively managed. (This data point is unsurprising since ETFs were initially created as purely passive vehicles.) Still, smart beta (often called factor funds) and traditional active strategies combine to hold 22% of ETF assets on the Envestnet programs. (Envestnet considers smart beta products to utilize a quantitative approach to active management.)
Drilling deeper into our asset class data reveals further interesting insights into the utilization of active and passive ETFs. We find notable differences when we examine which asset classes hold the most passive, smart beta, and traditional active assets in ETFs on the Envestnet platform. The table below summarizes our findings.
Top 5 ETF Asset Classes Ranked by AUM
| Passive | Smart Beta | Traditional Active |
|---|---|---|
| Large-Cap Core | Large-Cap Value | Hedged Equity |
| Large-Cap Growth | Large-Cap Core | Short Bond |
| Int'l Developed Mkts | Mid-Cap Value | Large-Cap Core |
| Large-Cap Value | Int'l Developed Mkts | Intermediate Bond |
| Intermediate Bond | Mid-Cap Core | Large-Cap Growth |
As of 4/30/2024. Data from the Advisor Managed and UMA programs. Source: Envestnet Intelligence.
While passive and, to a lesser extent, smart beta, ETF assets are heavily concentrated in major asset classes, the traditional active ETF asset ranking is led by two niche categories. Advisors may believe that active management is best utilized to exploit specific opportunities, or they may start exploring traditional active ETFs by using them as satellite positions to complement core smart beta and passive holdings. Mutual fund to ETF conversions could potentially drive more assets to major asset classes in the future, as may additional product launches and the continued decline of active mutual funds.
Active and passive ETF flows
In addition to the AUM breakdown presented earlier, we also want to investigate active and passive ETF flows through the Envestnet platform. Flows illuminate the activity under the surface of AUM, which is why we track them in depth. Let’s start by graphing cumulative flows from the last twelve months.
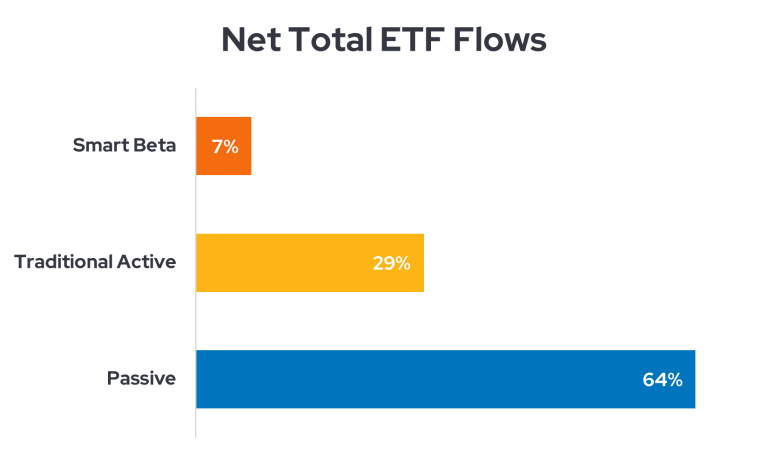
Not surprisingly, passive ETFs receive the greatest share of flows on the Envestnet platform. Given the industry’s focus on lower-cost solutions, passive leadership is likely to stay the same in the foreseeable future. However, the most interesting data point is that traditional active ETFs are gathering far higher net flows than smart beta products. While smart beta ETFs currently hold more assets on the Envestnet platform than traditional active ETFs, the gap is closing. These flow metrics illustrate the utilization of both active and passive ETFs.
Wrapping up
This article shows the breadth of demand for ETFs, although it does appear that advisors are using active and passive strategies to solve different aspects of the portfolio construction puzzle. Most notably, advisors have increasingly utilized active ETFs even as active mutual funds lose struggle. Our analyses support blending active and passive products, so we see a place for both approaches in the market. We encourage advisors to contact us for more research on combining active and passive strategies into portfolios.