Envestnet | PMC is an industry pioneer in blending the two opposing investment styles: active and passive. We have been implementing this approach within client portfolios well before the asset flow dominance into passive vehicles in recent years. We leverage Envestnet | PMC’s core competencies of manager research and due diligence, manager selection, asset allocation, and active/passive research to engage with our clients. We know active management is cyclical, but we are firm advocates of active strategies. We recognize the benefits of passive investing, too.
Market overview
The second quarter of 2025 extended the turbulence that began earlier in the year, as investors grappled with ongoing U.S. policy shifts, escalating trade tensions, and a brief military conflict between Iran and Israel. Markets initially plunged following President Trump’s “Liberation Day” tariff announcement, with equities dropping 10% in a week before rebounding sharply when the tariffs were delayed. Despite continued geopolitical uncertainty and unpredictable policy moves, financial markets staged a strong recovery, with the S&P 500 Index rallying 24.5% from its April low to end the quarter up 10.94%. Dollar weakness was a dominant theme in Q2, with the greenback falling in both risk-off and risk-on environments. The DXY Index dropped 7.1% during the quarter and over 10% from its January peak, marking a clear break from past patterns where rate spreads drove currency direction.
Despite the strong rally in U.S. equities, international equities outperformed, boosted by a weakening dollar, evolving trade dynamics, and domestic reforms abroad. Domestically, tech was the best-performing sector, boosting the performance of growth indices. Small caps and value equities also participated, though gains were more modest.
Fixed income markets remained relatively stable despite the equity rally. The Federal Reserve’s decision to hold rates steady at its June meeting was well anticipated by the markets and supported bond performance. While U.S. Treasury yields remained flat in aggregate, the curve steepened over the quarter as the bond market digested the implications of the current administration’s proposed tax and spending bill. The 10-year yield ended the quarter flat at 4.24%, leading to positive returns across most bond sectors. Investment-grade bonds posted modest gains, while high yield spreads tightened in response to improved risk appetite, allowing the asset class to outperform its investment grade counterpart. Despite the differential in yields versus the U.S., global bonds outperformed U.S. fixed income, mainly as a result of the broad U.S. dollar weakness.
However, despite the U.S. dollar’s continued decline, commodities fell in Q2. Gold, silver, and copper maintained their upward trends, with gold remaining the top-performing asset over the past year, while oil prices declined on structural excess supply and a weaker global growth outlook for 2025. The Israeli-Iranian conflict in June did not affect oil and gas supplies over the long-term.
Our scorecard
Our ActivePassive Scorecard shows active funds beating their category benchmarks in 6 of the 19 asset classes we tracked for the second quarter. Year-to-date (YTD), active funds are ahead in 5/19 of these categories. Over the trailing twelve months (TTM), active funds led their category benchmarks in 4 of these analyzed asset classes.
Active managers again delivered a mixed bag of results in the second quarter. The same can be said of the YTD and TTM timeframes. Let’s delve into the performance details.
U.S. Equity
| Active Fund Category | Qtr Return | Vs. Benchmark | YTD Return | Vs. Benchmark | TTM Return | Vs. Benchmark |
|---|---|---|---|---|---|---|
| Large Cap Core | 9.90% | -1.20% | 5.68% | -0.44% | 12.86% | -2.81% |
| Large Cap Growth | 17.23% | -0.61% | 7.01% | 0.91% | 16.88% | -0.34% |
| Large Cap Value | 4.24% | 0.45% | 5.69% | -0.31% | 12.15% | -1.55% |
| Mid Cap Core | 7.08% | -1.45% | 2.36% | -2.48% | 10.46% | -4.74% |
| Mid Cap Growth | 14.01% | -4.19% | 4.32% | -5.46% | 15.10% | -11.39% |
| Mid Cap Value | 4.24% | -1.11% | 1.88% | -1.24% | 9.05% | -2.49% |
| Small Cap Core | 6.76% | -1.74% | -1.77% | 0.01% | 6.07% | -1.61% |
| Small Cap Growth | 10.47% | -1.50% | -1.32% | -0.84% | 8.05% | -1.68% |
| Small Cap Value | 4.76% | -0.20% | -2.93% | 0.23% | 4.77% | -0.76% |
Data from Morningstar as of 6/30/2025. The Morningstar US Active Fund categories used in this analysis represent US-domiciled mutual funds and exchange-traded funds classified as actively managed by Morningstar. The asset classes are represented by (in order of table): Russell 1000 TR USD, Russell 1000 Growth TR USD, Russell 1000 Value TR USD, Russell Mid Cap TR USD, Russell Mid Cap Growth TR USD, Russell Mid Cap Value TR USD, Russell 2000 TR USD, Russell 2000 Growth TR USD, and Russell 2000 Value TR USD.
Value equities posted a modest gain during the quarter but significantly underperformed growth stocks across all capitalization levels. The Russell 3000 Value Index advanced 3.84%, trailing the Russell 3000 Growth Index by 13.71%. Value stocks gave up all of their relative gains from the first quarter and now lag growth by 25 basis points year-to-date. Still, large cap value managers beat our asset class benchmark for the quarter. Across the rest of the U.S. active landscape, no major asset class saw active strategies outperform in Q2. Mid cap growth managers continued to struggle with a majority of funds failing to beat our category benchmark, making strategy due diligence especially important in this asset class. Large cap growth funds have outperformed YTD, though.
Small cap equities rebounded strongly in the second quarter but failed to match the pace of large cap stocks. The Russell 2000 Index gained 8.50%, underperforming the Russell 1000 Index’s 11.11% return. Small cap managers also lagged our asset class benchmarks during Q2, but small cap core and value managers have outperformed YTD.
Non-U.S. Equity
| Active Fund Category | Qtr Return | Vs. Benchmark | YTD Return | Vs. Benchmark | TTM Return | Vs. Benchmark |
|---|---|---|---|---|---|---|
| Developed Markets | 11.67% | -0.11% | 19.01% | -0.44% | 18.43% | 0.70% |
| Emerging Markets | 12.87% | 0.88% | 14.56% | -0.71% | 12.95% | -2.34% |
Data from Morningstar as of 6/30/2025. The Morningstar US Active Fund categories used in this analysis represent US-domiciled mutual funds and exchange-traded funds classified as actively managed by Morningstar. The asset classes are represented by (in the order of table): MSCI EAFE NR USD and MSCI EM NR USD.
During Q2, international equities continued to show resilience and outperformed U.S. equities, buoyed by the weaker dollar, policy shifts, and supportive external conditions. Easing trade tensions between the US and China created a tailwind for emerging market equities. The MSCI EAFE and MSCI Emerging Markets indices gained 11.78% and 11.99%, respectively, outperforming the Russell 3000 Index’s 10.99% return. Emerging markets active managers delivered additional outperformance for Q2, as well. Developed markets strategies lagged in Q2, however, as gains concentrated in European defense and industrial shares. Japanese stocks also delivered selective opportunities during the quarter. Over the last twelve months, developed markets managers have delivered outperformance throughout a very volatile period for global equities.
Fixed Income
| Active Fund Category | Qtr Return | Vs. Benchmark | YTD Return | Vs. Benchmark | TTM Return | Vs. Benchmark |
|---|---|---|---|---|---|---|
| Intermediate Bond | 1.20% | -0.01% | 3.87% | -0.15% | 5.98% | -0.09% |
| Short-Term Bond | 1.59% | 0.31% | 3.26% | 0.34% | 6.42% | 0.47% |
| Intermediate Muni | 0.30% | -1.05% | 0.25% | -2.03% | 1.67% | -2.63% |
| High Yield | 3.26% | -0.27% | 4.04% | -0.53% | 8.88% | -1.41% |
Data from Morningstar as of 6/30/2025. The Morningstar US Active Fund categories used in this analysis represent US-domiciled mutual funds and exchange-traded funds classified as actively managed by Morningstar. The asset classes are represented by (in order of table): Bloomberg US Agg Bond TR USD, Bloomberg US Agg 1-3 Yr TR USD, and Bloomberg Municipal 5 Yr 4-6 TR USD, Bloomberg US Corporate High Yield TR USD.
For Q2, yields on shorter-dated bonds declined modestly while longer maturities faced upward pressure. The Bloomberg US Aggregate 1-3 Year Index rose 1.27%, whereas the Bloomberg US Aggregate 10+ Year Index declined 0.12%. Heightened volatility across fixed income markets remained a constant theme during the second quarter, driven by macroeconomic concerns including a weaker growth outlook, fiscal uncertainty, and policy risks tied to tariff rollouts. The initial market response to new U.S. tariffs was a swift risk-off move, sending Treasury yields lower and credit spreads wider. However, the sell-off proved short-lived as investor sentiment improved in the latter half of the quarter, supported by cooling inflation data and growing expectations for a more dovish Fed stance.
The Bloomberg U.S. Aggregate Bond Index returned +1.21% for the quarter. Securitized (+1.18%) and Treasuries (+0.85%) underperformed the index, while Corporates (+1.82%) and Government-Related (+1.70%) outperformed. Intermediate-duration and lower-rated investment grade bonds led performance, while long-duration and AA-rated debt lagged.
The Treasury curve steepened over the quarter, with 2s10s widening by 19 bps and 2s30s by 38 bps. Shorter maturities (1-7 years) saw yields decline, while longer maturities rose modestly. The Fed held rates steady at 4.25-4.50%, citing stronger-than-expected labor market data and still-elevated inflation as justification for a patient, data-driven approach amid evolving fiscal and trade policies. Nonetheless, markets have increasingly priced in potential rate cuts later this year, reflecting growing concerns over slowing growth, persistent policy uncertainty and emerging signs of labor market softening. Short-term active bond managers delivered solid outperformance in Q2 and across the YTD and TTM timeframes. Municipal bond and core bond managers struggled, however some active strategies delivered benchmark-beating returns. A deep understanding of bond market trends and manager approaches can be important for fixed income fund selection.
High yield markets posted strong returns (+3.53%) despite early-quarter volatility. Spreads widened sharply in April following tariff announcements but tightened meaningfully by quarter-end. Lower-quality credits outperformed, with CCC-rated bonds returning 4.6% versus 3.6% for BB- and B-rated peers. Demand for yield and stable credit fundamentals supported risk assets, even as macro uncertainty persisted. Active high yield strategies continued to modestly lag in aggregate, though.
Diversifying Asset Classes
| Active Fund Category | Qtr Return | Vs. Benchmark | YTD Return | Vs. Benchmark | TTM Return | Vs. Benchmark |
|---|---|---|---|---|---|---|
| Commodities | -2.18% | 0.90% | 5.20% | -0.33% | 4.91% | -0.86% |
| Real Estate | -0.65% | 1.06% | 0.07% | 0.63% | 8.12% | 0.03% |
| TIPS | 0.60% | 0.12% | 4.39% | -0.28% | 5.86% | 0.01% |
| Bank Loan | 2.23% | -0.09% | 2.43% | -0.37% | 6.76% | -0.53% |
Data from Morningstar as of 6/30/2025. The Morningstar US Active Fund categories used in this analysis represent US-domiciled mutual funds and exchange-traded funds classified as actively managed by Morningstar. The asset classes are represented by (in order of table): Bloomberg Commodity TR USD, DJ US Select REIT TR USD, BBgBarc US Treasury US TIPS TR USD, and Morningstar LSTA LL TR USD.
In Q2, the bank loan asset class outpaced most fixed income sectors. The Morningstar LSTA U.S. Leveraged Loan Index gained 2.32%, compared to a 1.21% return for the Bloomberg U.S. Aggregate Bond Index. Active managers slightly underperformed this benchmark in Q2, however they posted strong aggregate outperformance across commodities, real estate, and Treasury Inflation-Protected Securities (TIPS). Real estate active managers swung to YTD and TTM outperformance, too. TIPS managers are also slightly beating our benchmark over the TTM timeframe.
Factor update
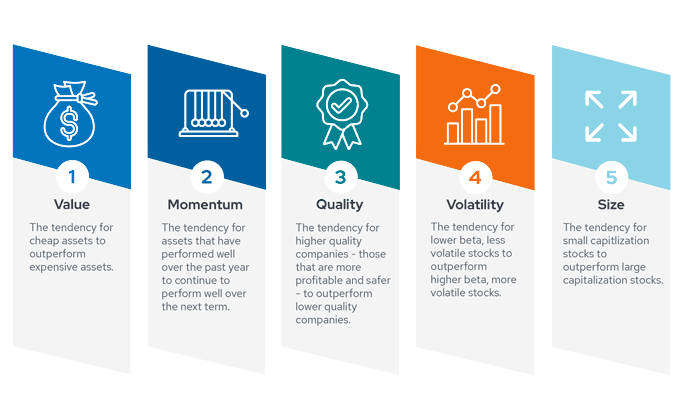
Below, we examine the performance of the five key factors (described by the infographic above) in the current market environment. This analysis is relevant to our scorecard because factors are integral to many active management strategies.
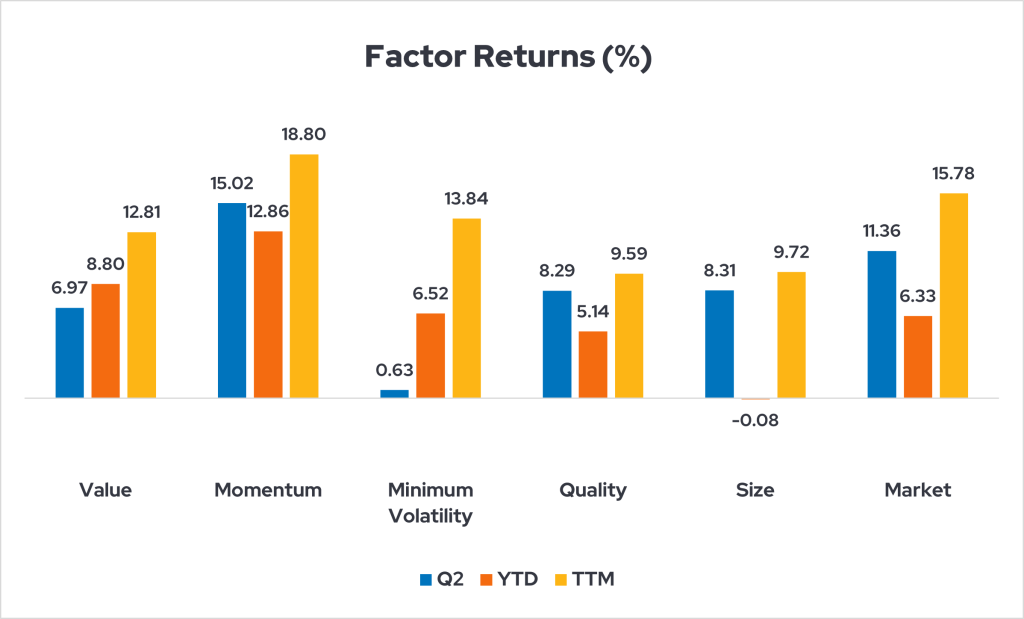
These indices represent U.S. factor returns: MSCI USA Enhanced Value, MSCI USA Momentum, MSCI USA Minimum Volatility, MSCI USA Quality, MSCI USA Small Cap, and MSCI USA GR USD. As of 6/30/2025. Data source: Morningstar.
- Momentum was the top-performing factor in Q2. While tariffs briefly interrupted market momentum, U.S. stocks rebounded sharply following their April plunge. The S&P 500 even recorded another record high to close Q2.
- Size is the only major U.S. factor with negative YTD returns as of 6/30/25. Small caps have lagged in the current environment, and small caps are synonymous with the Size factor.
- The Quality and Value factors delivered solid results in Q2, but the Minimum Volatility factor lagged other than during the tariff tantrum episode. For the year, however, the Momentum, Value, and Minimum Volatility factors have all beaten the Market as a whole.
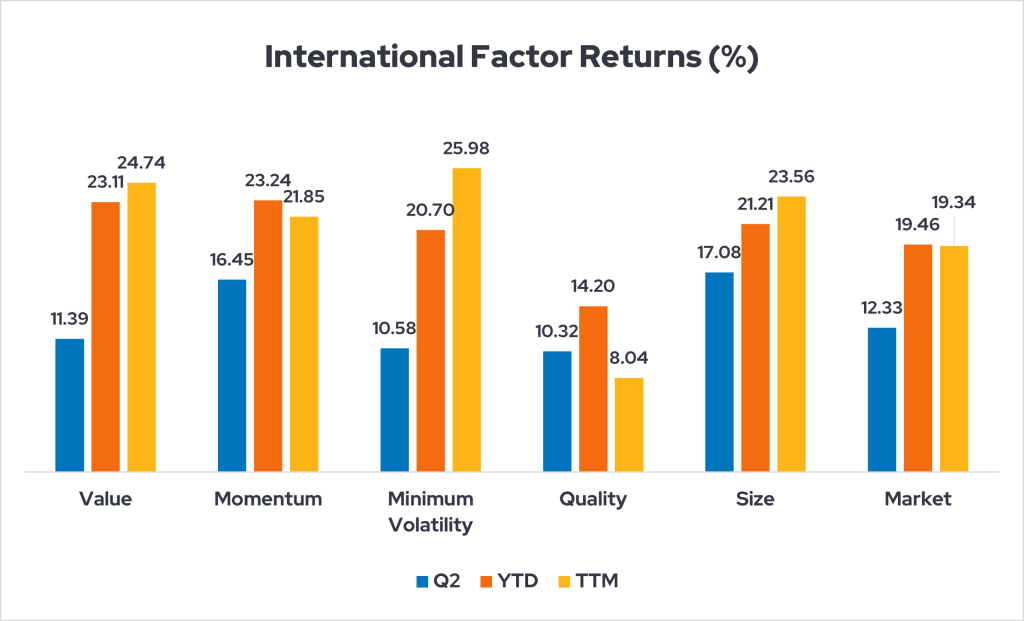
These indices represent international factor returns: MSCI ACWI Ex-US Momentum, MSCI ACWI Ex-US Enhanced Value, MSCI ACWI Ex-US Quality, MSCI ACWI Ex-US Small Cap, MSCI ACWI Ex-US Minimum Volatility, and MSCI ACWI Ex-US GR USD. Data source: Morningstar. As of 6/30/25.
- Q2 saw the non-U.S. Momentum and Size factors surge ahead as international markets continued to sprint higher.
- The Size factor has performed far better internationally this year than it has in the US. Because international markets can be less efficient than the US stock market, factor performance often varies widely between these markets.
The Quality, Value, and Minimum Volatility factors also delivered solid Q2 gains outside of the U.S. These factors lagged the Market, though.
Value in both active and passive management
This update on active and passive management covers a relatively short timeframe, but Envestnet | PMC has a long history of research and portfolio management using our ActivePassive methodology. This framework requires patience and a deep understanding of cyclical trends. Ultimately, though, we believe there are places and times for both active and passive management.
Learn more about ActivePassive investing at www.envestnet.com/active-passive