Envestnet | PMC is an industry pioneer in blending the two opposing investment styles: active and passive. We have been implementing this approach long before the craze of ETFs and the asset flow dominance into passive vehicles in recent years. This investment methodology is in our DNA. We leverage Envestnet | PMC’s core competencies of manager research and due diligence, manager selection, asset allocation, and active/passive research to engage with our clients. We know active management is cyclical, but we are firm advocates of active management. We also recognize the multiple benefits of passive investing. Ultimately, we are believers in both investment styles.
Market overview
The investor optimism that characterized the end of 2023 has persisted into 2024, with global equity markets maintaining strength despite shifts in anticipated interest rate cuts, geopolitical tensions, and regional economic challenges. Economic growth remained essential for global equity prices while investors closely monitored signs of a potential soft landing and the associated expectations of lower interest rates. Amidst this backdrop, financial conditions have remained accommodative despite short-term interest rates hovering around 5.3%.
In Q1 2024, equity markets continued their upward trajectory, with notable outperformance in U.S. equities. The S&P 500 Index achieved record highs, supported by a positive economic outlook and the potential for rate cuts. This signaled a broadening market rally beyond mega-cap technology stocks and marked the most robust Q1 performance in five years. Emerging markets posted positive absolute returns but trailed developed markets. Large caps extended their outperformance relative to their smaller-cap counterparts.
The Federal Reserve (Fed) kept its key federal funds rate unchanged at a range of 5.25-5.50% and indicated it still expects three rate cuts in 2024. The 10-year U.S. Treasury yield increased steadily from 3.88% at the end of 2023 to 4.20% by the end of March 2024, impacting various bond sectors negatively. High-yield assets outperformed investment-grade securities, while short-dated bonds showed resilience. Rising rates posed challenges for global government bonds as well, with the asset class trailing domestic fixed income. Oil, gold, and Bitcoin rebounded, and the U.S. dollar strengthened against most currencies.
Our scorecard
Our ActivePassive Scorecard shows active funds beating their category benchmarks in 11 of the 19 asset classes we tracked for the first quarter. Over the last 12 months, active funds have outperformed in 8 of these asset classes.
The first quarter was a relatively strong period for active managers as they topped our category benchmarks in 58% of the asset classes we track. Over the past twelve months, though, active management beat only 42% of these category benchmarks. Let’s delve into the details of our scorecard.
U.S. Equity
| Active Fund Category | Qtr Return | Vs. Benchmark | TTM Return | Vs. Benchmark |
|---|---|---|---|---|
| Large Cap Core | 9.94% | -0.35% | 27.18% | -2.69% |
| Large Cap Growth | 12.13% | 0.71% | 36.84% | -2.16% |
| Large Cap Value | 8.95% | -0.03% | 21.12% | 0.85% |
| Mid Cap Core | 9.00% | 0.40% | 21.94% | -0.41% |
| Mid Cap Growth | 9.22% | -0.27% | 22.72% | -3.56% |
| Mid Cap Value | 7.96% | -0.27% | 21.10% | 0.71% |
| Small Cap Core | 6.20% | 1.02% | 19.41% | -0.30% |
| Small Cap Growth | 7.91% | 0.33% | 18.25% | -2.09% |
| Small Cap Value | 5.20% | 2.30% | 20.43% | 1.68% |
Data from Morningstar as of 3/31/2024. The Morningstar US Active Fund categories used in this analysis represent US-domiciled mutual funds and exchange-traded funds classified as actively managed by Morningstar. The asset classes are represented by (in order of table): Russell 1000 TR USD, Russell 1000 Growth TR USD, Russell 1000 Value TR USD, Russell Mid Cap TR USD, Russell Mid Cap Growth TR USD, Russell Mid Cap Value TR USD, Russell 2000 TR USD, Russell 2000 Growth TR USD, and Russell 2000 Value TR USD.
Actively managed U.S. equity funds outperformed in 5/9 categories in Q1. Small cap managers notably exceeded benchmark returns across the core, growth, and value investment styles. This success is worth watching because the ongoing bull market began to lift a broader range of stocks in Q1. Small caps have outpaced large caps since the most recent market lows in late October of 2023. One of the main reasons for this outperformance is that most small cap managers have higher market caps relative to indexes, which benefited them during the quarter as larger-cap stocks outperformed small caps. Also, most small cap managers have been underweight financials—specifically regional banks—since the banking crisis in early 2023. This underweight has also been additive to excess returns. However, only value managers beat our category benchmarks in the trailing twelve months (TTM). Growth managers delivered significant underperformance over this timeframe, though, which may be partially due to concentrated gains in a small number of AI-related stocks.
Non-U.S. Equity
| Active Fund Category | Qtr Return | Vs. Benchmark | TTM Return | Vs. Benchmark |
|---|---|---|---|---|
| Developed Markets | 5.25% | -0.54% | 13.21% | -2.10% |
| Emerging Markets | 3.02% | 0.65% | 10.34% | -2.19% |
Data from Morningstar as of 3/31/2024. The Morningstar US Active Fund categories used in this analysis represent US-domiciled mutual funds and exchange-traded funds classified as actively managed by Morningstar. The asset classes are represented by (in the order of table): MSCI EAFE NR USD and MSCI EM NR USD.
As we turn to international equities, we find that emerging market active fund managers delivered solid quarterly results and also generated excess returns over the past twelve months. Actively managed developed market funds, meanwhile, delivered lackluster performance in Q1 and over the last twelve months. This underwhelming aggregate performance comes as Japanese stocks have excelled while European equities have yielded largely underwhelming gains. British stocks have been volatile but underperformed their U.S. counterparts in Q1 and the past twelve months.
Fixed Income
| Active Fund Category | Qtr Return | Vs. Benchmark | TTM Return | Vs. Benchmark |
|---|---|---|---|---|
| Intermediate Bond | -0.46% | 0.32% | 2.12% | 0.43% |
| Intermediate Muni | 0.94% | 0.48% | 5.00% | 1.44% |
| Short-Term Bond | 0.15% | 0.52% | 3.34% | 1.39% |
| High Yield | 1.72% | 0.24% | 10.35% | -0.81% |
Data from Morningstar as of 3/31/2024. The Morningstar US Active Fund categories used in this analysis represent US-domiciled mutual funds and exchange-traded funds classified as actively managed by Morningstar. The asset classes are represented by (in order of table): Bloomberg US Agg Bond TR USD, Bloomberg Municipal 5 Yr 4-6 TR USD, Bloomberg US Agg 1-3 Yr TR USD, and Bloomberg US Corporate High Yield TR USD.
Active managers posted Q1 excess returns in all four fixed income asset classes tracked for this scorecard. This success is noteworthy because the quarter proved to be far from smooth. U.S. interest rates rose in Q1 as inflation stopped falling, creating a significant change in the bond market. Over the TTM timeframe, active fixed income managers outperformed in 3/4 of these asset classes—Q1 wasn’t a total fluke. Continued active management success in fixed income categories will be worth watching. Most active managers we engage with expect continued market choppiness until there is more clarity around the economic backdrop and interest-rate policy. We believe this provides an opportunity for active fixed income managers as they have the flexibility to shift their portfolios given the dynamic nature of fixed income markets.
Diversifying Asset Classes
| Active Fund Category | Qtr Return | Vs. Benchmark | TTM Return | Vs. Benchmark |
|---|---|---|---|---|
| TIPS | -0.13% | -0.05% | 0.26% | -0.20% |
| Commodities | 3.87% | 1.67% | 1.42% | 1.98% |
| Real Estate | -0.62% | -0.23% | 8.43% | -2.03% |
| Bank Loan | 2.32% | -0.11% | 11.57% | -0.88% |
Data from Morningstar as of 3/31/2024. The Morningstar US Active Fund categories used in this analysis represent US-domiciled mutual funds and exchange-traded funds classified as actively managed by Morningstar. The asset classes are represented by (in order of table): Bloomberg Commodity TR USD, BBgBarc US Treasury US TIPS TR USD, DJ US Select REIT TR USD, and Morningstar LSTA LL TR USD.
Although not notable asset classes in most investor portfolios, we want to highlight some key diversifying asset classes and how active management has fared in these as well. The positive news is that we see overall active management success in the Commodities category for Q1 and the last twelve months. Commodity prices had a good first quarter, but the market had struggled in the previous year. As for the TIPS, real estate, and bank loan funds, which we term diversifying assets, underperformance for active managers was the norm. Real estate active management results have been especially weak over the TTM period.
Factor update
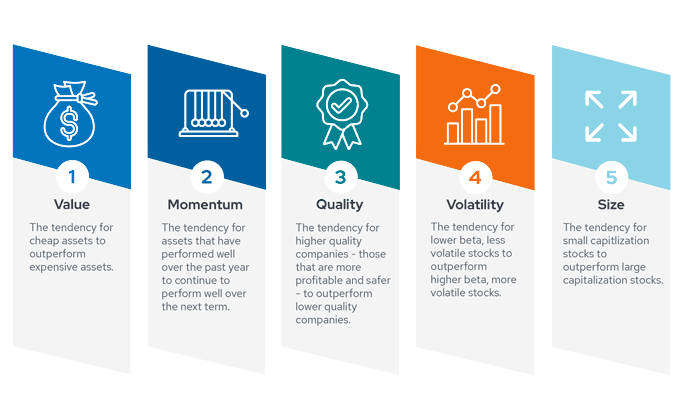
The performance of factors can significantly impact active manager success, mainly because factors are deeply intertwined with investment approaches and styles. Thus, factors are very relevant to this scorecard. Rewarded risk factors are also widely recognized as fundamental components of equity returns. Envestnet | PMC believes that the most robust among the studied risk factors are Value, Momentum, Quality, Low Volatility, and Size. Like all return components, though, factors are cyclical.
Below, we examine the performance of six factors in the current market environment. (Note that the Growth factor can be viewed as the inverse of the Value factor in its construction.)
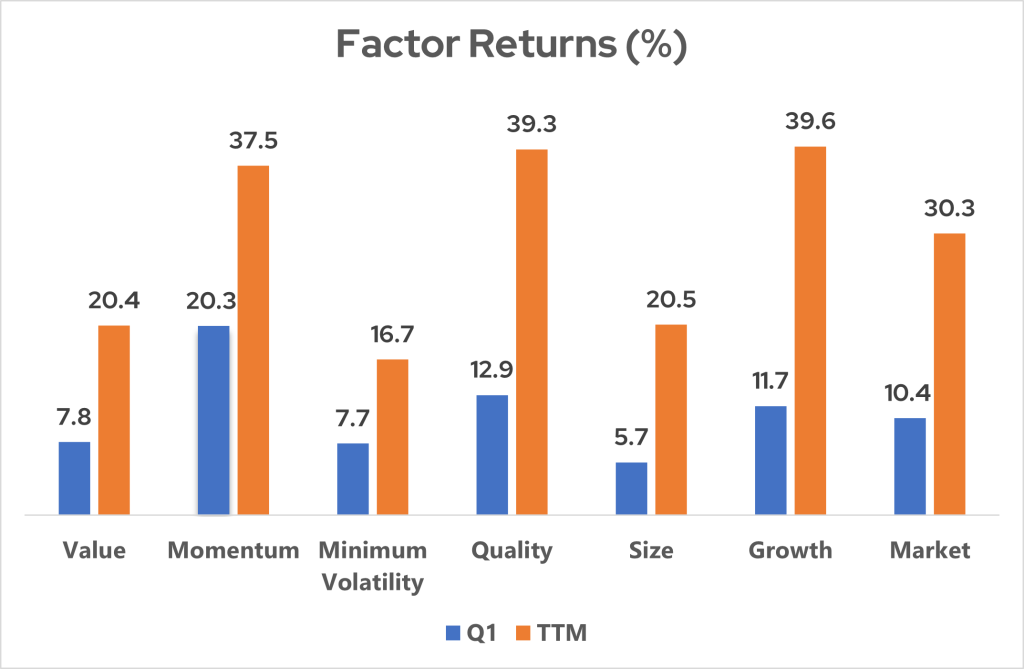
These indices represent U.S. factor returns: MSCI USA Enhanced Value, MSCI USA Momentum, MSCI USA Minimum Volatility, MSCI USA Quality, MSCI USA Small Cap, MSCI USA Growth, and MSCI USA GR USD. Data source: Morningstar.
- The Momentum factor led the way in Q1 as top performers from Q4 of 2023 generally continued to excel. This factor struggled in 2022 and for part of 2023 as the market whipsawed.
- The Quality factor also posted a strong performance in Q1 and has excelled over the last twelve months. The Quality factor has become associated with the mega cap stocks that have led much of this rally.
- The Size factor generated the lowest return in Q1 as large cap stocks led their smaller brethren. We did, however, notice market breadth improve later in the quarter. If small caps catch up to large caps this year, the Size factor could perform well.
- Over the TTM timeframe, the Growth factor is leading while the Minimum Volatility factor is the laggard. Value’s results are currently in the middle of the pack.
- Note that the Market factor is equivalent to beta in this analysis. We use the MSCI USA index to represent the Market factor.
The power of both active and passive management
This update on active and passive management covers a relatively short timeframe, but Envestnet | PMC has a long history of research and portfolio management using our ActivePassive methodology. This framework requires patience and a deep understanding of cyclical trends. Ultimately, we believe there is a place and a time for both active and passive management.
For more information on Envestnet | PMC, please visit www.investpmc.com