Rewarded risk factors are recognized as a fundamental component of equity returns. Envestnet | PMC believes that the most robust among the studied risk factors are value, momentum, quality, low volatility, and size. Like all return components, factors are cyclical in nature. Below, we take a look at the performance of these factors in the current market environment.
How factors have fared
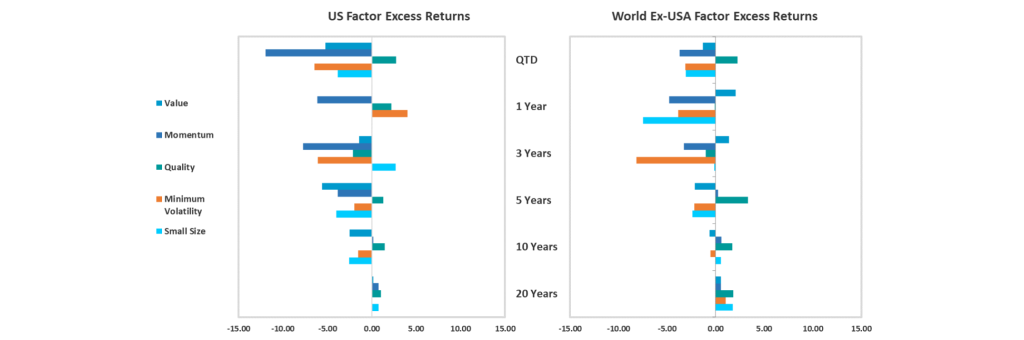
Stock prices were mixed in the first quarter following a recovery in the fourth quarter of 2022. There was a significant amount of dispersion in returns, with some equity sectors gaining almost 22%, while others declined by more than 4%. Factor performance was similarly divergent in the U.S., ranging from roughly -12% (for momentum) and roughly +2.75% (for quality). International stocks generated positive results during the quarter, and generally outperformed U.S. equities. Ex-U.S. factors had a notably narrower, though directionally similar, range of results.
Quality benefitted tangentially from a run on technology and other growth equities, many of which score highly on typical quality metrics like return on assets and earnings growth. Part of the outperformance of growth, and by extension quality to some extent, may have stemmed from rebalancing to targets after expiration of the wash sale window following tax loss harvesting of underperforming growth names at the end of 2022. January saw growth outperform value by over 300 basis points. Further, investors may have preemptively repriced growth as interest rates came down over the course of the quarter. The last month of the quarter saw an even wider growth-to-value disparity at over 800 basis points.
Despite the first quarter’s relative performance, value still has lots to recommend it in the current market environment. Many of the obstacles for corporate earnings remain in place, including high inflation, the rise in interest rates, and an economy that some analysts believe will eventually encounter a recession in 2023. Value tends to outperform growth over the long-term, and has historically excelled most in market environments like this.
Momentum was the worst performing factor for the first quarter. Environments characterized by rapid rotation in leadership are a hard hurdle for momentum to mount.
With markets climbing in the first quarter, the low volatility factor fell behind and ended in the red both here and abroad. This factor performs the best in highly risk-averse market environments and over the long term serves to reduce volatility in a portfolio.
The small size factor performed similarly here and abroad, both posting modest negative returns.
When observed over long-term periods, research suggests that these factors have added value on a risk-adjusted basis when compared to market capitalization-weighted portfolios. As a result, it is most appropriate to think of factor-investing as active investing – making intentional tilts away from market capitalization just as a traditional stock picker may do. Read more about our perspective on factors as active in our latest Factor Insights piece.

Glossary
Factor Definitions
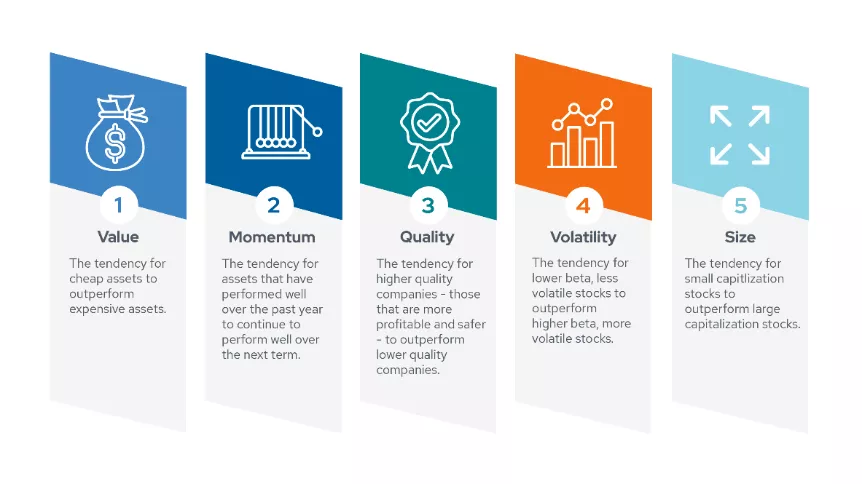
- Value: The tendency for cheap assets to outperform expensive assets. (See Basu, S. “Investment Performance of Common Stocks in Relation to Their Price-Earnings Ratios: A Test of the Efficient Market Hypothesis.” Journal of Finance, 1977.)
- Momentum: The tendency for assets that have performed well over the past year to continue to perform well over the near-term. (See Jegadeesh, N and S. Titman. “Returns to Buying Winners and Selling Losers: Implications for Stock Market Efficiency.” The Journal of Finance, 1993.)
- Quality: The tendency for higher quality companies – those that are more profitable and safer – to outperform lower quality companies. (See Novy-Marx, R. “The Other Side of Value: The Gross Profitability Premium.” Journal of Financial Economics, 2013.)
- Minimum Volatility: The tendency for lower beta, less volatile stocks to outperform higher beta, more volatile stocks. (See Ang, A., Hodrick, R. Xing, Y. and X. Zhang. “The Cross-Section of Volatility and Expected Returns.” The Journal of Finance, 2006.)
- Size: The tendency for small capitalization stocks to outperform large capitalization stocks. (See Banz, R. “The Relationship Between Return and Market Value of Common Stocks.” Journal of Financial Economics, 1981.)
Benchmark Definitions
- The MSCI USA Momentum Index is designed to reflect the performance of an equity momentum strategy by emphasizing large and mid cap US stocks with high price momentum.
- The MSCI USA Quality Index is designed to capture the performance of large and mid cap US quality growth stocks by identifying stocks with high quality scores based on three main fundamental variables: high return on equity (ROE), stable year-over-year earnings growth and low financial leverage.
- The MSCI USA Minimum Volatility is designed to reflect the performance characteristics of a minimum variance strategy applied to the large and mid cap US equity universe by optimizing the MSCI USA Index for the lowest absolute risk (within a given set of constraints).
- The MSCI USA Enhanced Value Index is designed to represent the performance of large- and mid-cap US equity securities that exhibit higher value characteristics relative to their peers within the corresponding GICS® sector. The value investment style characteristics are defined using price-to-book, price-to-forward earnings, and enterprise value-to-cash flow from operations.
- The MSCI USA Small Cap Index is designed to measure the performance of the small cap segment of the US equity market.
- The MSCI World ex USA Momentum Index is designed to reflect the performance of an equity momentum strategy by emphasizing large and mid cap stocks across developed market countries excluding the US with high price momentum.
- The MSCI World ex USA Quality Index is designed to capture the performance of quality growth stocks by identifying stocks of large and mid cap stocks across developed market countries excluding the US with high quality scores based on three main fundamental variables: high return on equity (ROE), stable year-over-year earnings growth and low financial leverage.
- The MSCI World ex USA Minimum Volatility Index is designed to reflect the performance characteristics of a minimum variance strategy applied to the MSCI large and mid cap equity universe across developed market countries excluding the US by optimizing the MSCI World ex USA Index for the lowest absolute risk (within a given set of constraints).
- The MSCI World ex USA Enhanced Value Index is designed to represent the performance of large- and mid-cap universe across developed market countries excluding the US that exhibit higher value characteristics relative to their peers within the corresponding GICS® sector. The value investment style characteristics are defined using price-to-book, price-to-forward earnings, and enterprise value-to-cash flow from operations.
- The MSCI World ex USA Small Cap Index is designed to measure the performance of the small cap equity universe across developed market countries excluding the US.
- The MSCI USA Growth Index is designed to represent US large and mid cap securities exhibiting overall growth style characteristics as measured by five growth variables.